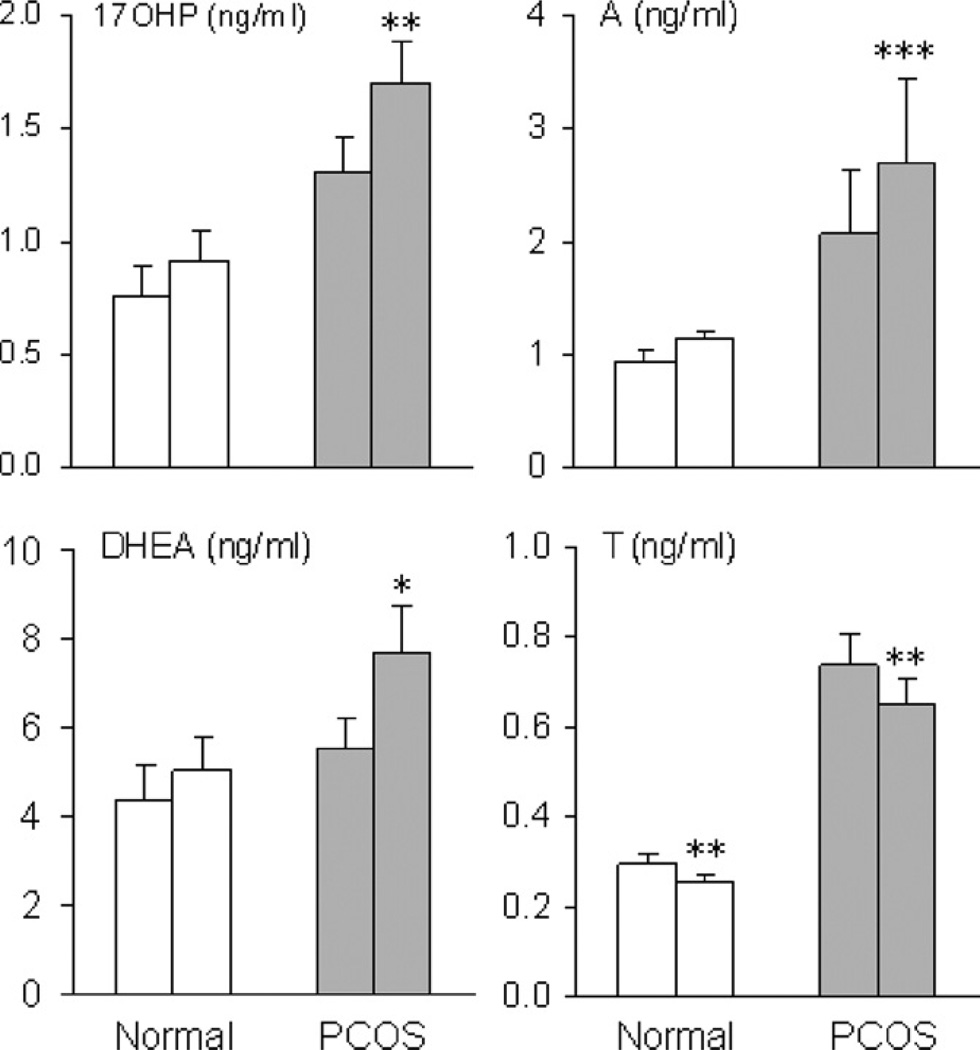
Fig. 7.
Mean (±SE) serum 17-OHP, A4, DHEA, and T levels before and 24 h after administration of hFSH, 150 IU, in PCOS and normal women. A significant change from baseline is denoted by an asterisk. *P < 0.05; **P < 0.02; ***P < 0.001. (Conversion of 17-OHP, A4, T, and DHEA to SI units by factors of 3.03, 3.49, 3.47, and 3.47, respectively).

