
Figure 11.
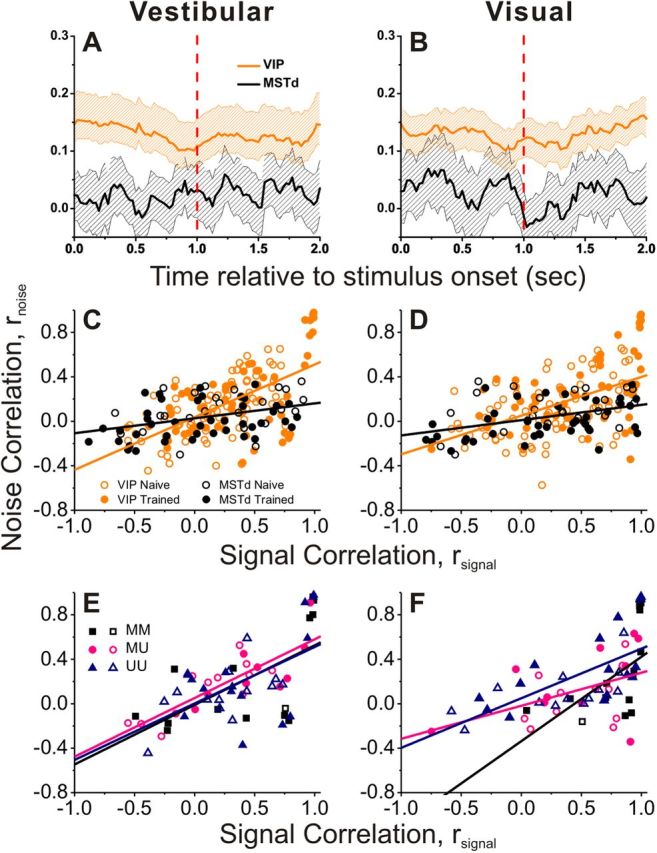
Comparison of the interneuronal correlations between VIP and MSTd. A, B, Average (±95% CI) time course of noise correlation (rnoise) in area VIP (orange) and MSTd (black) during vestibular (A) and visual (B) stimulation (VIP: n = 139; MSTd: n = 67). C, D, Relationship between rnoise and signal correlation (rsignal) in area VIP (orange) and MSTd (black) during vestibular (C) and visual (D) stimulation. Data are separated into those recorded from naive (open symbols, VIP: n = 75; MSTd: n = 25) and trained (filled symbols, n = 64; MSTd: n = 42) animals. Lines show linear regression fits to the data from each area (pooled across naive and trained animals). E, F, VIP data with significant tuning either to vestibular or visual stimuli for each pair, now separated into the type of recorded pair. MM (Multisensory + Multisensory), both cells were multisensory (n = 14); UM (Unisensory + Multisensory), one cell was multisensory, the other unisensory (n = 21); and UU (Unisensory + Unisensory), both cells were unisensory (n = 29). Lines represent regression fits (ANCOVA). Only data recorded from a single electrode are shown (MSTd data from Gu et al., 2011).