Figure 3.
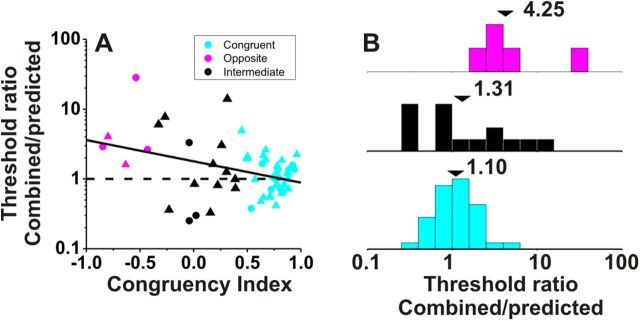
Improvement in neuronal sensitivity under cue combination depends on congruency of visual and vestibular tuning. A, Scatter plot of the ratio of the threshold measured in the combined condition relative to the prediction for optimal cue integration (Gu et al., 2008) versus the local CI (see Materials and Methods). Cyan symbols are used for congruent neurons with CI > 0.4 (n = 36); magenta symbols are used for opposite neurons with CI < −0.4 (n = 5); black symbols mark intermediate neurons for which −0.4 < CI < 0.4 (n = 15). Dashed horizontal line: threshold in the combined condition is equal to the prediction. Solid line shows type II linear regression. Triangles and circles denote data from monkeys C and U, respectively. B, Marginal distributions comparing this ratio for opposite (magenta), intermediate (black), and congruent (cyan) VIP neurons. Arrowheads illustrate geometric mean values.

