
Figure 7.
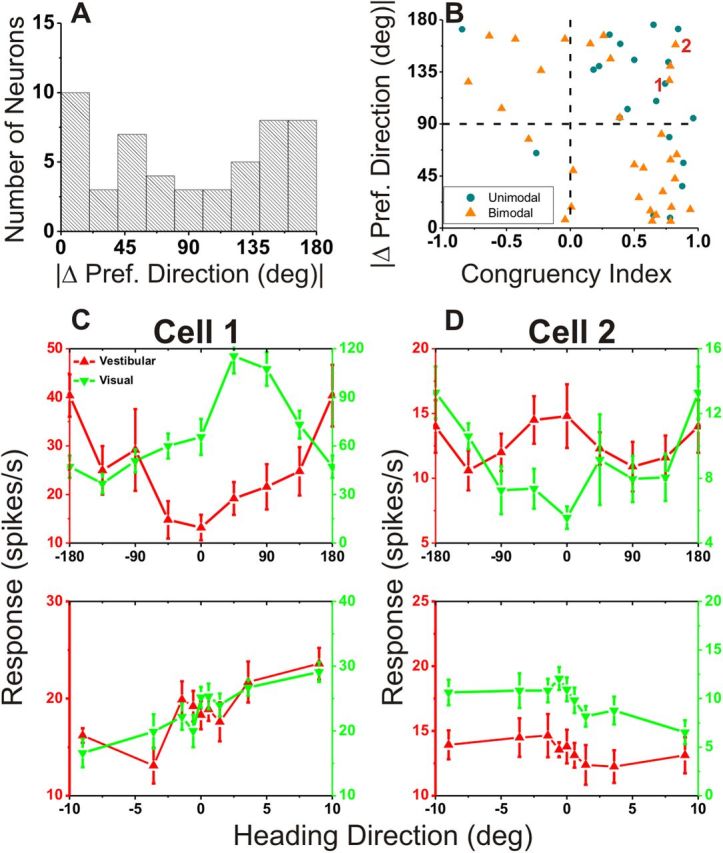
Relationship between local and global measures of visual/vestibular congruency. A, Global congruency, defined as the difference between vestibular/visual preferred headings, |Δ Preferred Heading|, computed from horizontal plane tuning curves (as in Gu et al., 2006; Chen et al., 2011c). B, Scatter plot comparing the global measure (from A) and the local measure (CI; see Materials and Methods). Blue circles represent cells with unimodal heading tuning curves for both the vestibular and visual conditions. Orange triangles denote neurons with bimodal heading tuning in either the vestibular or visual condition. Data are only shown for multisensory neurons (n = 56). C, D, Global and local tuning curves for two cells (marked “1” and “2” in B) for which local and global congruency measures do not agree well. Cells 1 and 2 would be classified as opposite based on global congruency (|Δ Preferred Heading| = 124.9 and 158.4°), or congruent based on local congruency (CI = 0.74 and 0.82). Red, vestibular tuning curves; green, visual tuning curves.