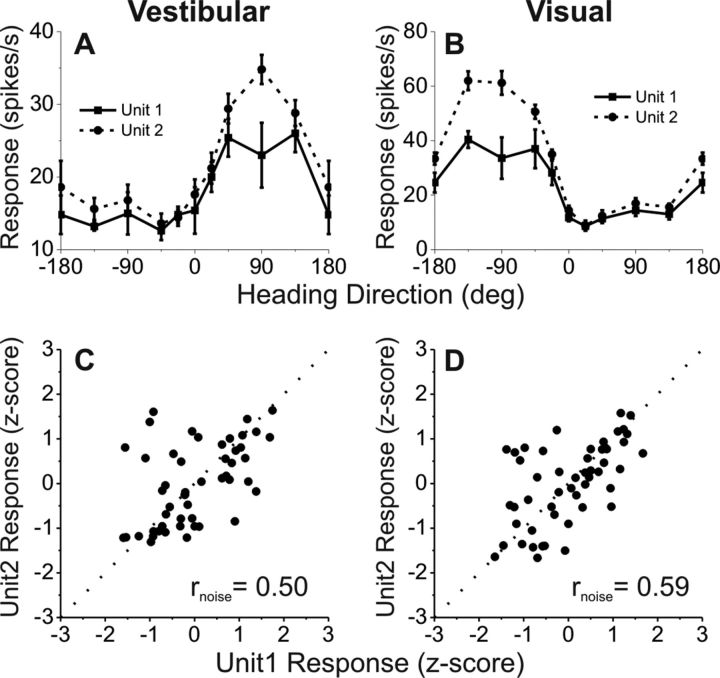
Figure 9.
Measuring noise correlation (rnoise) between pairs of single neurons recorded simultaneously from the same electrode. A, B, Examples of vestibular (A) and visual (B) heading tuning curves for a pair of simultaneously recorded VIP neurons (solid and dashed black curves). Responses are plotted as a function of heading direction in the horizontal plane, with 0° indicating a straight forward trajectory. Error bars indicate SEM. C, D, Normalized responses from the same two neurons were weakly correlated across trials during vestibular (C) and visual (D) stimulation, with noise correlation values of rnoise = 0.50 and 0.59, respectively. Dotted lines mark the unity-slope diagonal.

