Figure 6.
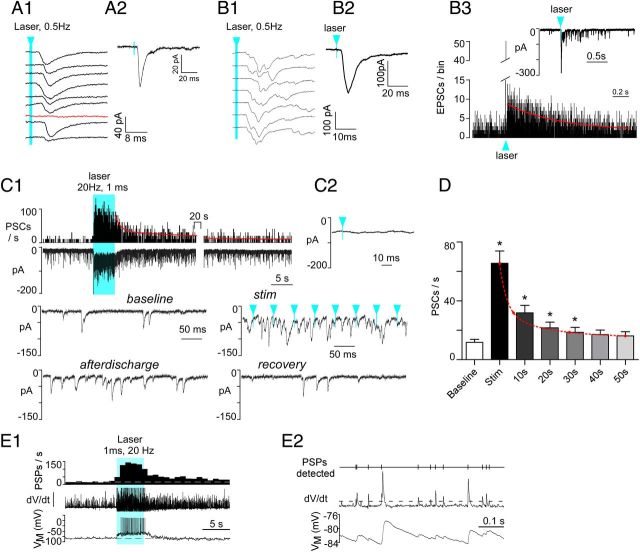
Photostimulation of ChR2-labeled axons produces PSCs in DMV neurons and increases their discharge rate. A1, Compound PSC (note variable latency) evoked in a DMV neuron clamped at −79 mV by nine consecutive 1 ms light flashes (473 nm) delivered at 0.5 Hz. The red trace denotes a failure. Blue arrowhead and line indicates time of laser onset throughout figure. A2, Event-triggered average of the PSCs evoked in the cell shown in A1 (75 stimuli). B1, Compound PSC evoked in another DMV neuron (VM −79 mV) by nine consecutive 1 ms light flashes (473 nm) delivered every 2 s. This second example illustrates a larger and more multiphasic response. B2, Event-triggered average of the EPSC evoked in the cell shown in B1 (75 stimuli). B3, The inset shows the EPSC after-discharge that follows the large initial EPSC and the main graph is a peri-event histogram depicting the probability of occurrence of EPSCs following the laser flashes. The red line is a single exponential with a time constant of 0.6 s that fits the kinetics of the after-discharge with a probability of 0.9. C1, Top trace, Integrated rate histogram of the PSC frequency before, during, and after photostimulation (20 Hz, 1 ms, train duration 5 s, laser on time represented by solid blue block). Second trace from top, Original recording obtained from DMV neuron clamped at VM −79 mV. Lower traces, Higher resolution excerpts from the original recording. Note that, during high-frequency photostimulation, the evoked PSCs are asynchronous with respect to the light pulses. Solid blue block indicates period of photostimulation. C2, Event-triggered average of the PSCs evoked by photostimulation (100 light pulses). Note that the trace is flat indicating asynchrony between PSCs and light pulses. D, Group data showing the average kinetics of the after-discharge (N = 16 neurons); *p < 0.001 between group and baseline except 30 s, p < 0.05. E1, Response of a DMV neuron to photostimulation of RVLM-CA neuron input (1 ms, 20 Hz, 5 s). Bottom trace, Original current-clamp recording (−10 pA bias current injected to silence the cell). Middle trace, First differential of original trace to highlight postsynaptic potentials (PSPs). Top trace, PSP frequency (integrated rate histogram, 1 s bin). Period of photostimulation is indicated by solid blue block. E2, High-resolution excerpt illustrating (from the bottom up) the original recording, the first differential used to detect PSPs and analyze their frequency (dotted line, detection threshold) and the detected PSPs.

