Figure 3.

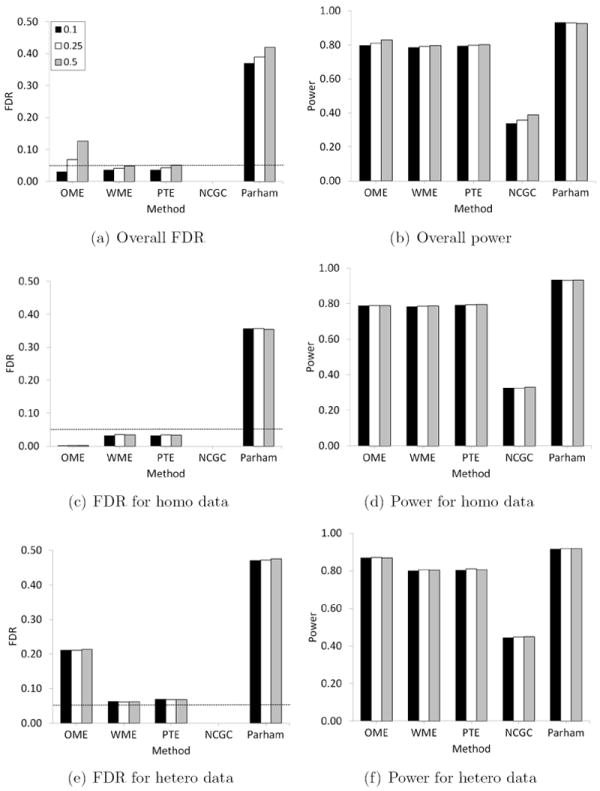
Estimated FDR and power for OME, WME, PTE, NCGC and Parham methods when the proportion of heteroscedastic data is 0.10, 0.25 and 0.50. Here γ = 0.10 and α = 0.05/10, 000.

Estimated FDR and power for OME, WME, PTE, NCGC and Parham methods when the proportion of heteroscedastic data is 0.10, 0.25 and 0.50. Here γ = 0.10 and α = 0.05/10, 000.