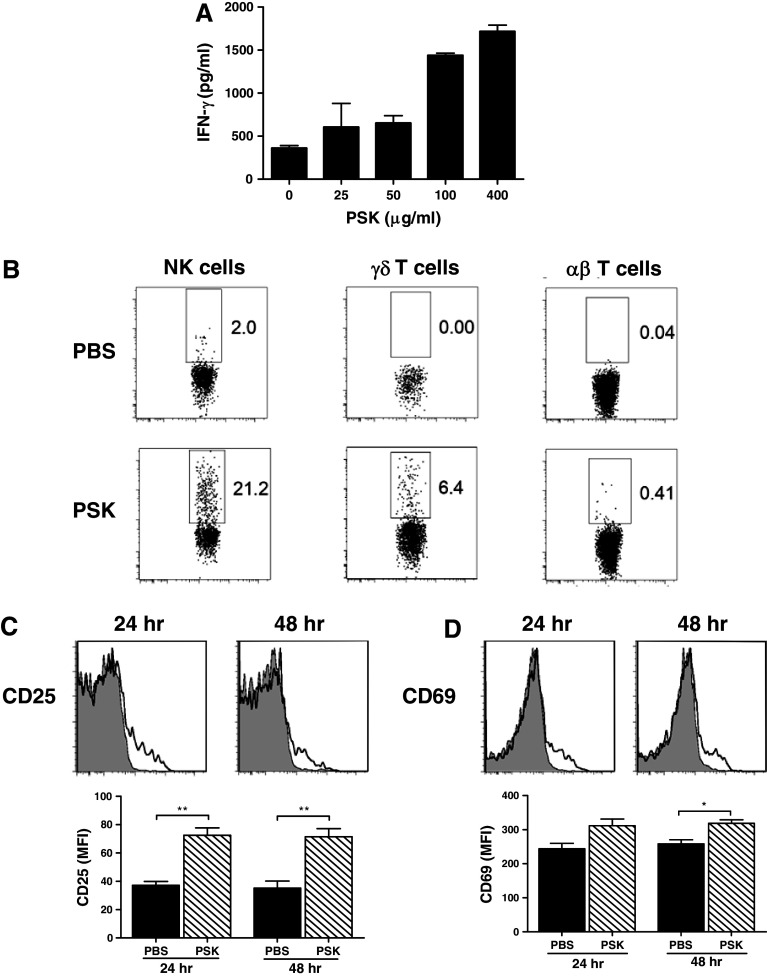
Fig. 1.
Gamma delta T cells are activated by PSK to produce IFN-γ. a Dose–response of PSK-stimulated IFN-γ production by splenocytes. Shown are mean ± SD of IFN-γ levels in triplicate culture wells treated with serial dilutions of PSK for 48 h, as determined by ELISA. Similar results were obtained from three independent experiments. b Representative FACS dot plots showing intracellular staining of IFN-γ in NK cells, γδ T cells, or αβ T cells in splenocytes from neu-transgenic mice. Splenocytes were treated with PSK (100 μg/ml) for 48 h. Similar results were obtained from three independent experiments. c, d Expression of CD25 and CD69 on γδ T cells in PSK-treated splenocytes. Shown are representative overlay histograms. Gray histogram: control; empty histogram: PSK-treated γδ T cells. The bar graphs summarize the results from three independent experiments. *p < 0.05, **p < 0.01 by two-tailed Student’s t test

