Fig. 2.
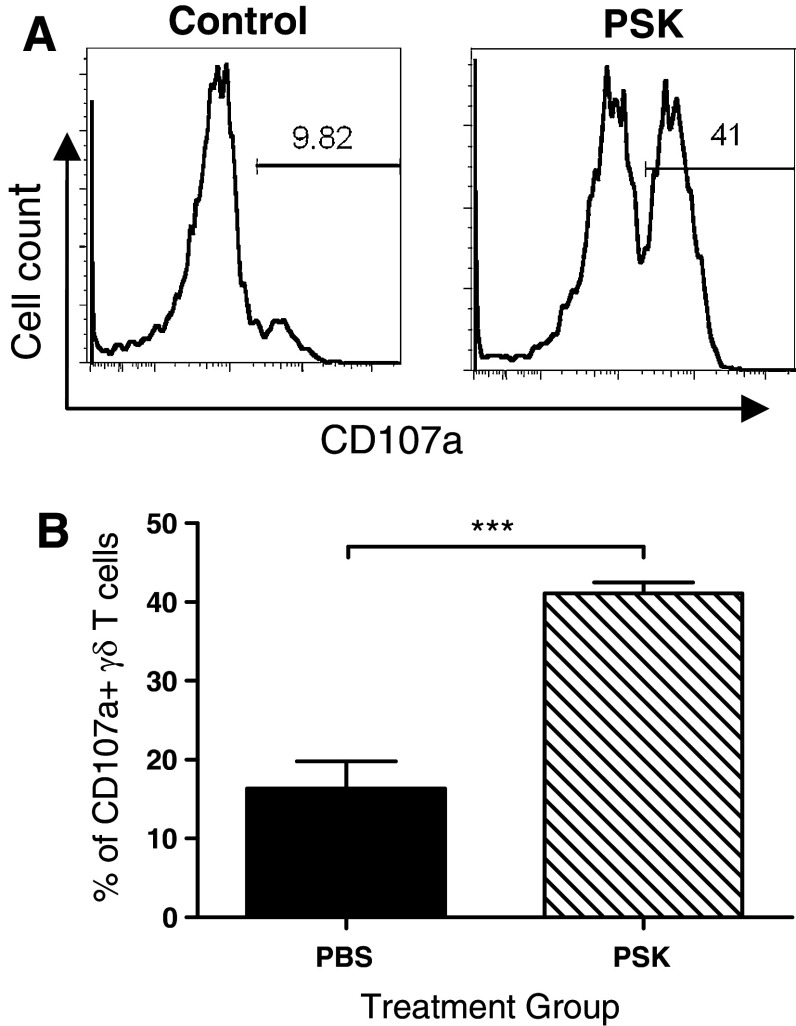
PSK induces CD107a degranulation in γδ T cells. a Representative histograms showing the percentages of CD107a+ γδ T cells in control and PSK-treated splenocytes. b Summary graph showing the percentages of CD107a+ cells among total γδ T cells. The bars represent mean ± sem of results from three independent experiments. ***p < 0.001 by Student’s t test

