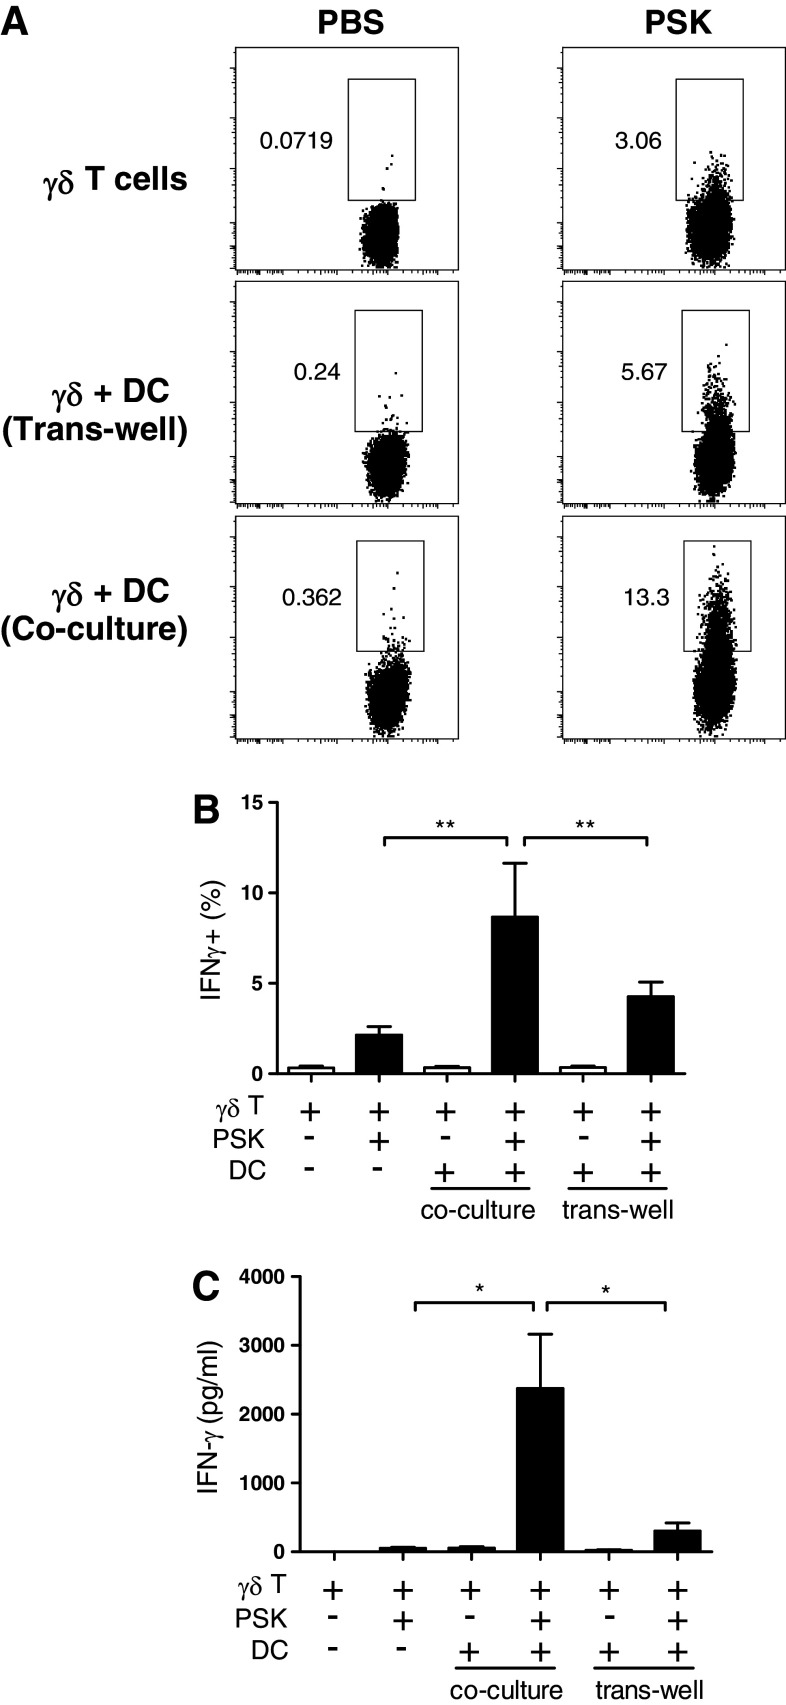
Fig. 4.
Direct contact between DC and γδ T cells is required for PSK-induced IFN-γ production. a Representative dot plots showing the expression of IFN-γ in control PBS- and PSK-treated γδ T cells in different culture systems: γδ T cell alone, γδ + DC trans-well culture, or γδ + DC co-culture. b Bar graph summarizing the percentage of IFN-γ+ γδ T cells in PBS- and PSK-treated γδ T cells in different culture systems. The graph summarizes the results from three independent experiments. c Bar graph summarizing the level of IFN-γ in PBS- and PSK-treated γδ T cells in different culture systems. The graph summarizes the results from three independent experiments. *p < 0.05, **p < 0.01, by two-tailed Student’s t test

