
FIGURE 2.
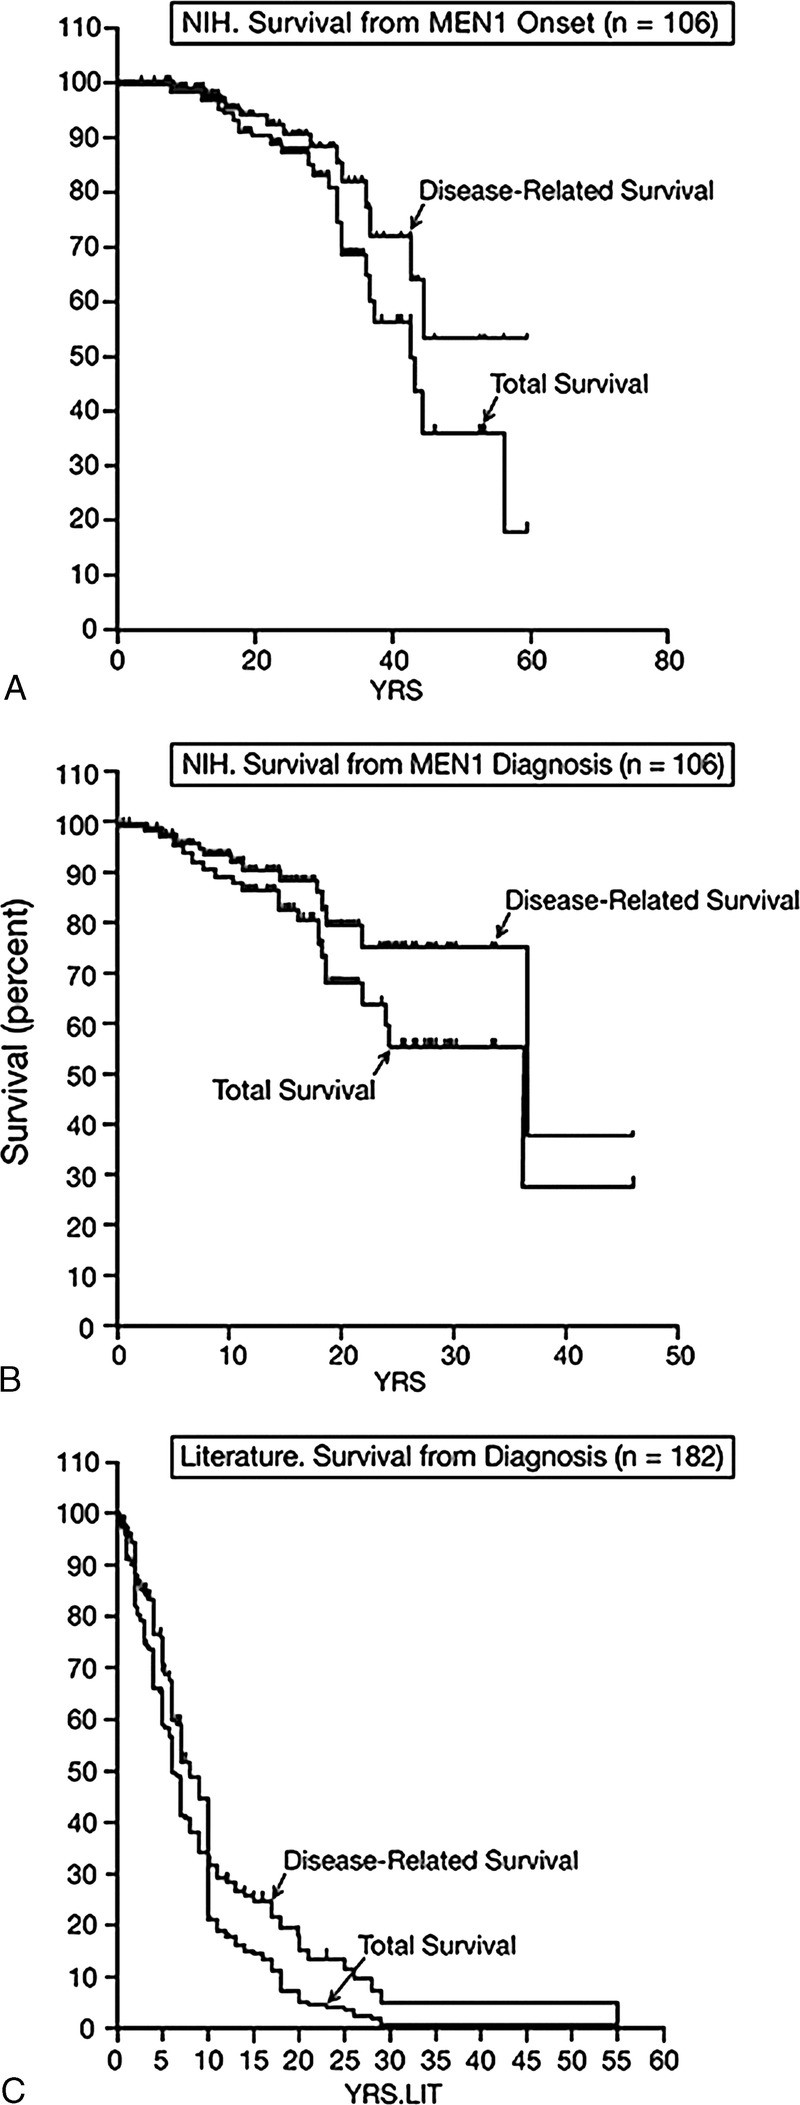
Total and disease-related survival for the 2 groups of MEN1/PET patients studied. In the top 2 panels survival data for the 106 NIH MEN1/ZES patients are shown in Kaplan and Meier plots. The top panel shows disease-related and total survival from the time of MEN1 onset and the middle panel from the time of MEN1 diagnosis. The bottom panel shows total survival and disease-related survival from the time of MEN1 diagnosis for the 227 MEN1/PET patients from the pooled literature review of case reports and small series.