
Fig. 3. Two different methods for quantifying immunohistochemistry data.
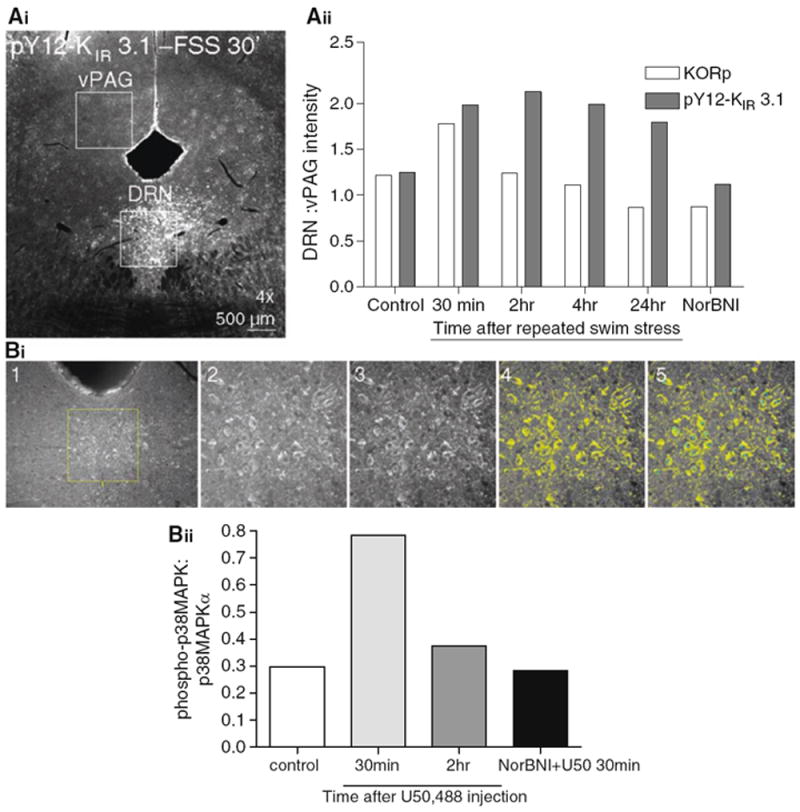
(Ai) An example image in which the intensities of two identically sized areas in the same section are compared from a stressor exposed animal. The serotonergic dorsal raphe demonstrates increases in pY12-KIR3.1-IR while the ventral periaqueductal gray is unchanged. (Aii). A ratio is constructed the KORp or pY12-KIR 3.1 DRN:vPAG intensity over a for three slices from a subject an averaged to generate a single N. The graph demonstrates a time course of KORp and pY12-KIR 3.1 activation following repeated swim stress. Activation of both proteins is not present in subjects treated with the selective KOR antagonist norBNI. (Bi) Outlines the steps necessary when using the cell-counting technique to characterize the amount of phospho-immunoreactivity compared to the nonphospho-immunoreactivity. 1. Select region, 2. Zoom in on region, 3. “auto-enhance,” 4. set intensity threshold to one standard deviation above mean, 5. Toggle between threshold on/off and count cells that meet BOTH morphological AND intensity criterion. (Bii) An example experiment looking at the time course of p38 MAPK activation following intraperitoneal injection of the selective KOR agonist U50,488.