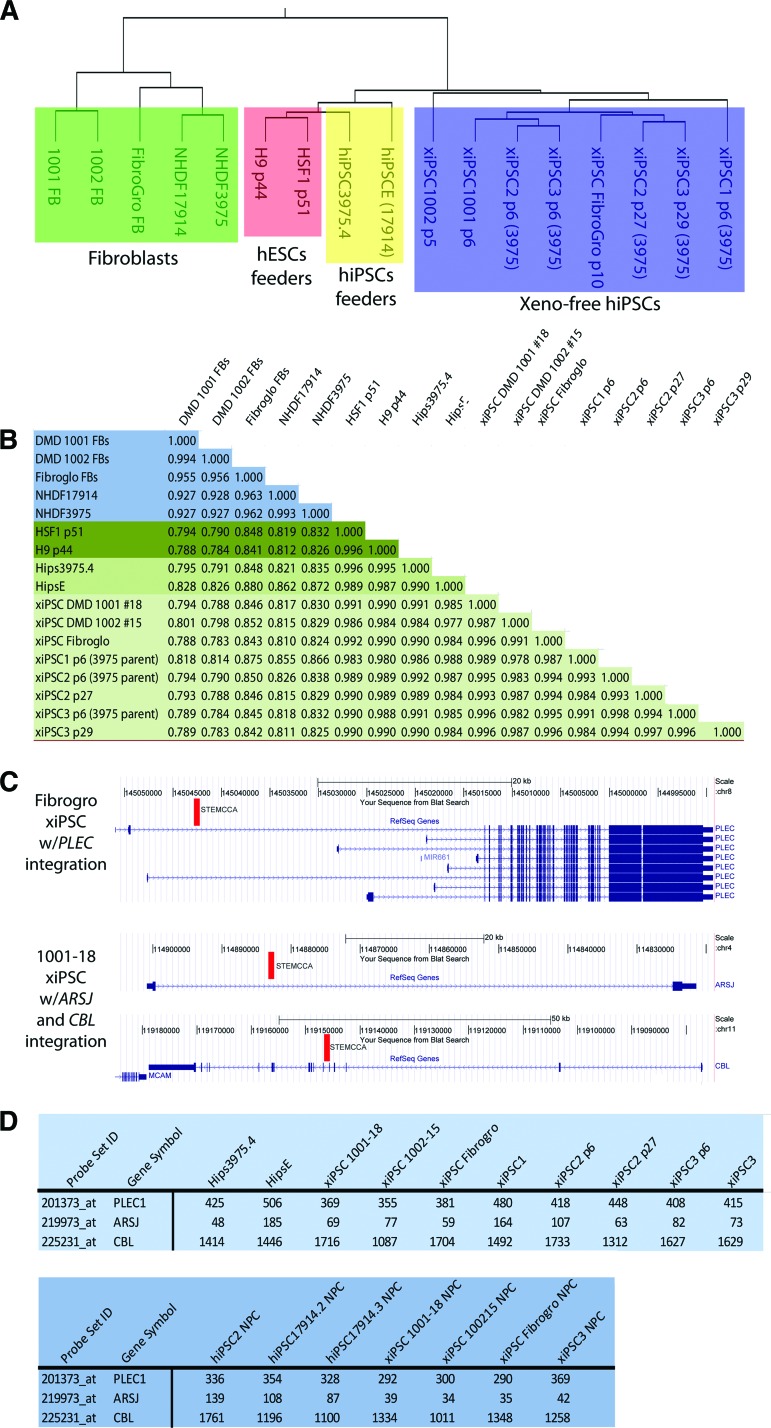
Figure 3.
Comparative gene expression analysis of Good Manufacturing Practice hiPSCs with hiPSCs and hESCs grown on feeders. (A): Block in green indicates fibroblasts, orange for hESCs on feeders, yellow for hiPSCs on feeders, and blue for the different xeno-free iPSCs analyzed. (B): Pearson analysis shows very minor differences in the global expression of genes between the xeno-free xiPSCs and iPSCs derived on feeders at different passage numbers. (C): Mapping of integration sites for the floxable polycistron used to reprogram shows that the STEMCCA integration is found either once or twice in two lines, and in each case is found in the intron of a gene (indicated by red bar). (D): Expression analysis indicates that these integrations did not influence expression of these genes.

