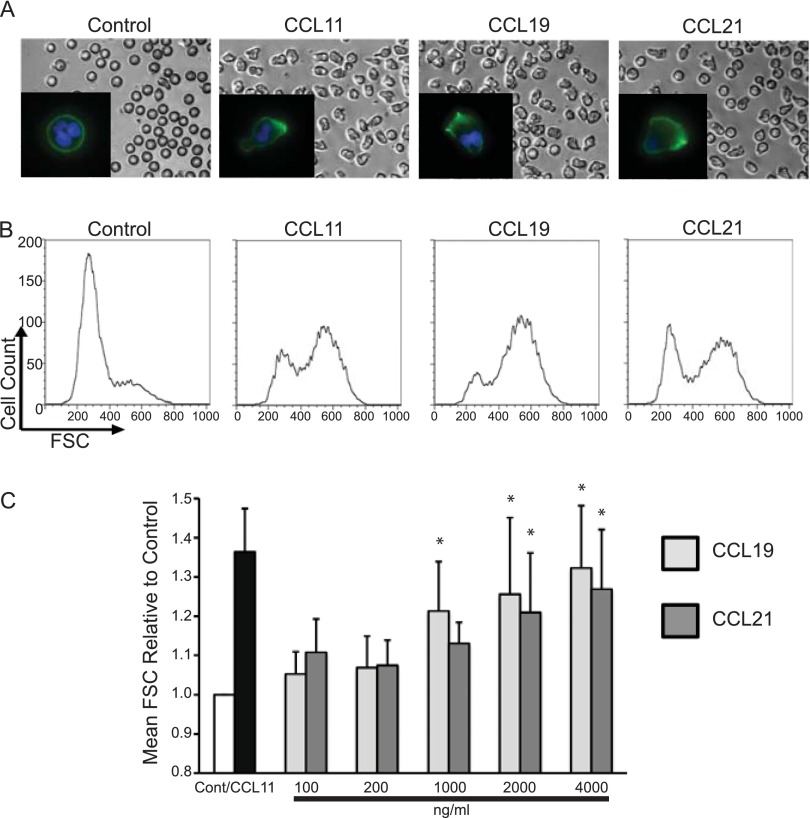
Figure 3.
CCR7-mediated shape changes and F-actin rearrangement. (A) Visualization of shape change by microscopy. Eosinophils were cultured with IL-5 for 48 hours and then stimulated with vehicle, CCL11 (100 ng/ml), CCL19 (2 μg/ml), or CCL21 (2 μg/ml) for 10 minutes. F-actin staining with Alexa 488–conjugated phalloidin appears in green, and Hoescht nuclear staining appears in blue (insets). (B) Quantification of shape changes at above chemokine doses and duration by flow cytometric analysis of forward scatter (FSC). Histograms of shape change data are from a single experiment representative of four separate experiments from four separate donors. Forward-scatter versus side-scatter plots of these data are presented in Figure E6. (C) Aggregate data from shape change experiments (four experiments). Bar graphs demonstrate a concentration-dependent (10-min stimulation) increase in mean forward scatter expressed as a ratio to vehicle-treated control cells (Cont). (Dunnett’s multiple comparisons test, *P < 0.05).

