
Figure 1.
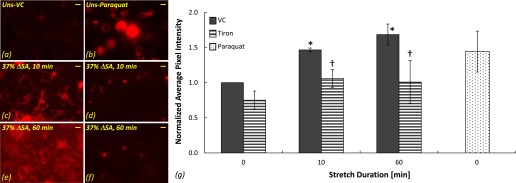
Reactive oxygen species (ROS) stained with CellRox in type I–like rat alveolar epithelial cells (RAECs). Representative images of ROS in unstretched cells treated with vehicle control (VC) (a) and the superoxide donor paraquat (b) and in cells that were stretched at 37% change in surface area (ΔSA) for 10 minutes (c and d) and 60 minutes (e and f) treated with VC (c and e) and the superoxide scavenger tiron (d and f). Bar = 10 μm. (g) Average pixel intensity computed in CellRox images of stretched and unstretched cells expressed as mean ± SEM of fold change above unstretched cells treated with VC. *P < 0.05 versus unstretched VC. †P < 0.05 versus stretched VC.