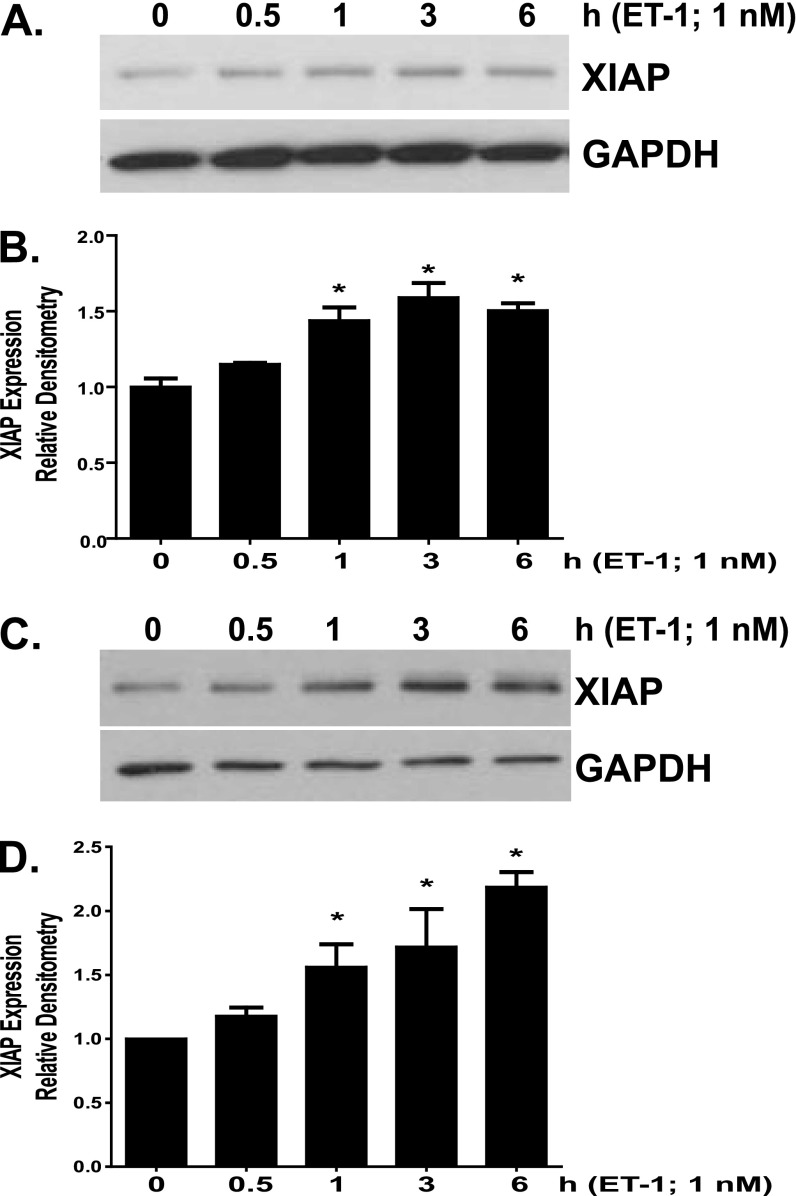
Figure 4.
IMR-90 (A and B) and CCL-210 (C and D) fibroblasts were treated with endothelin (ET)-1 (1.0 nM). (A and C) Cell lysates were analyzed for XIAP expression by Western blotting, and each blot was stripped and reprobed for GAPDH. (B and D) Each experiment was completed in triplicate; XIAP/GAPDH ratios were indexed to untreated cells for each blot. *P < 0.01 compared with untreated controls.

