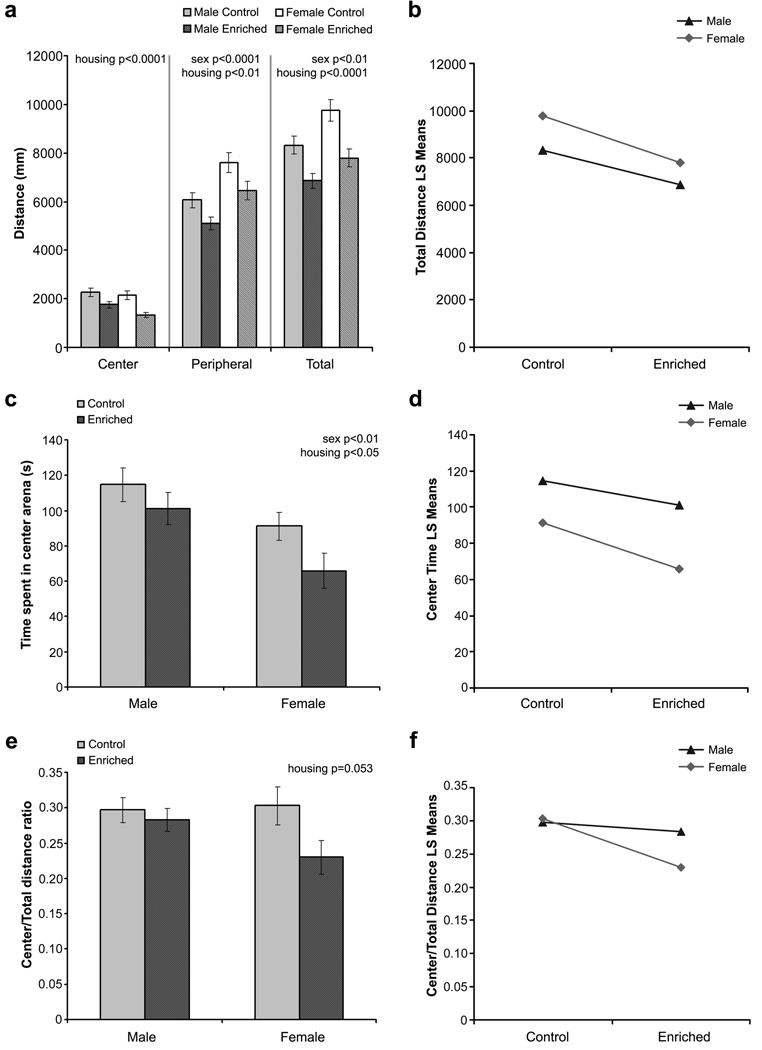
Fig. 2.
Mice performance in the open field test. (a) Distance traveled in the different regions of the open field and total distance traveled. (b) Interaction plot for total distance traveled. (c) Time spent in the center of the open field. (d) Interaction plot for time spent in the center zone. (e) Ratio of distance traveled in the center zone of the open field. (f) Interaction plot for center to total distance ratio. All data are presented as mean ± standard error of the mean (S.E.M).

