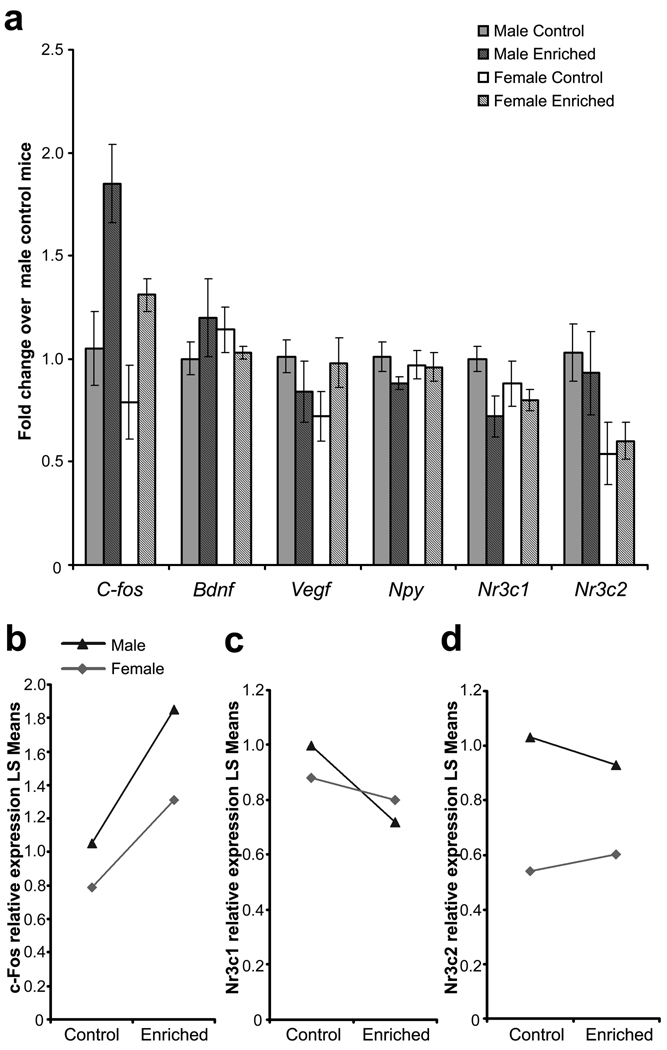
Fig. 5.
(a) Hippocampal mRNA expression 10 days after differential housing. Data are presented as fold change over the mean value of male standard housing control group. All data are presented as means ± S.E.M. (b) Interaction plot for C-fos mRNA expression. Housing effect, P = 0.001; Sex effect, P < 0.05. (c) Interaction plot for Nr3c1 mRNA expression. (d) Interaction plot for Nr3c2 mRNA expression. Sex effect, P < 0.05.

