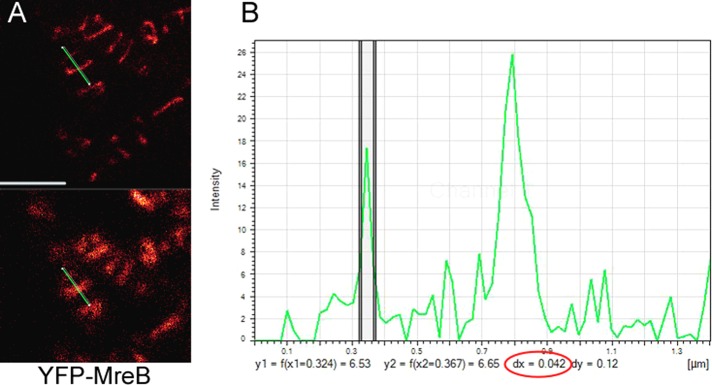
FIGURE 6:

Measurement of the thickness of YFP-MreB filaments in exponentially growing B. subtilis cells. (A) G-STED image (top) and conventional confocal image (bottom). The green bar indicates the line scan through a thin and a much thicker filament. (B) Intensity plot of the line scan. The y axis shows fluorescence intensity, and the x axis shows size in micrometers. The two vertical lines indicate the half-maximum intensity of the filament, which has a diameter of 42 nm (number circled in red); the thicker filament is on the right and has a size of 85 nm.
