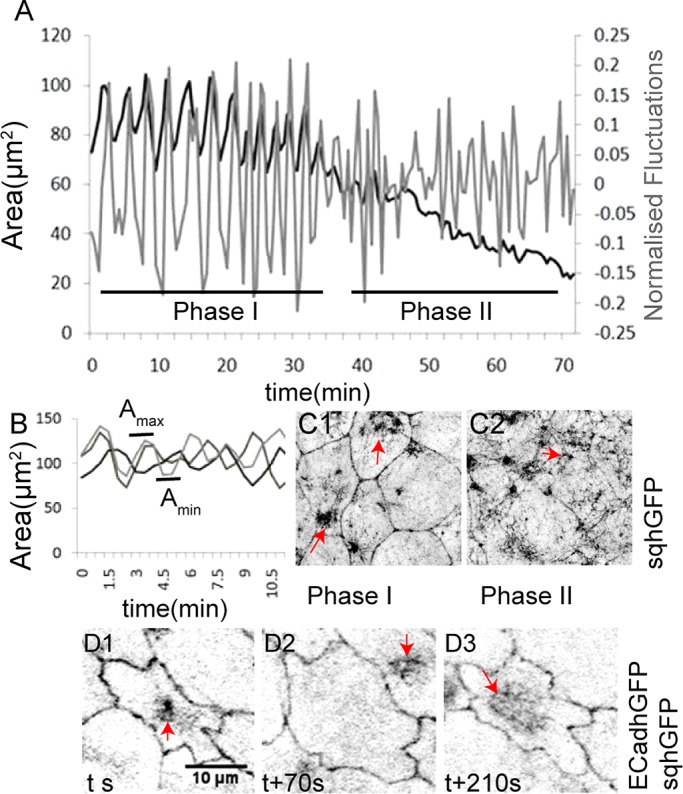
FIGURE 1:

Membrane and myosin dynamics accompanying pulsed apical constrictions in the amnioserosa. (A) A representative curve of the apical area dynamics (black) and normalized fluctuations (gray) of a single AS cell during native closure. Asynchrony of Amax and Amin (B) and sqhGFP pulses (D1–D3, red arrows) in three adjacent cells from one embryo. (C1, C2) Myosin (sqhGFP, red arrows) reorganization accompanying the transition from phase I to phase II.
