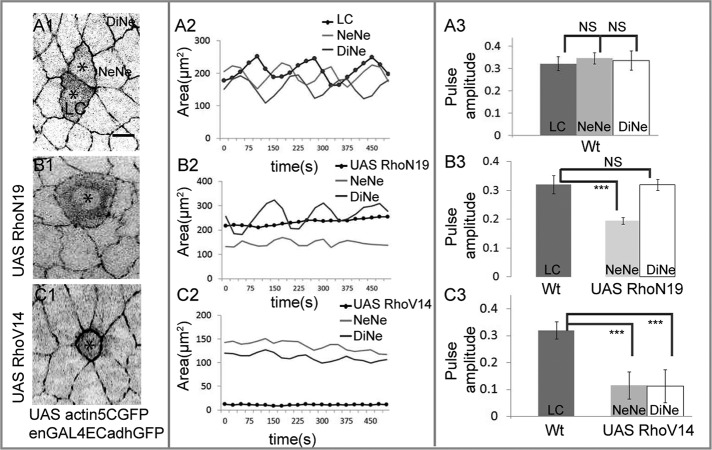
FIGURE 4:
The Rho1 GTPase influences pulsed apical membrane dynamics autonomously and nonautonomously. The behavior of cohorts of wild-type cells and their neighbors (A) compared with cohorts of single cells expressing dominant-negative (B) or constitutively active (C) Rho. Left (A1, B1, C1), single snapshots from time-lapse confocal images depicting changes in geometry associated with expression of actin GFP alone (A1) or in combination with dominant negative (B1) or constitutively active (C1) Rho in single cells (asterisk in A1, B1, C1) and in their NeNe and DiNe. Middle (A2, B2, C2), area dynamics respectively of one cohort each associated with a single cell expressing UAS Actin5CGFP alone (A2) or in combination with UAS RhoN19 (B2) or UAS RhoV14 (C2). Each cohort is represented by one labeled/perturbed cell (black curves in A2, B2, C2) and one NeNe and one DiNe (light and dark gray curves, respectively, in A2, B2, C2). Right (A3, B3, C3), pulse amplitudes (mean ± SD) of the NeNe (light gray bars) and DiNe (white bars) of cells expressing UAS RhoN19 (B3) or UAS RhoV14 (C3) in comparison with the amplitude of unperturbed labeled cells (LC, dark gray bars), which are indistinguishable from their NeNe and DiNe (A3). See Supplemental Figures S3 and S4 for supporting data. A3: n = 3 for LC, 8 for NeNe, and 6 for DiNe from three embryos. B3: n = 3 for LC, 10 for NeNe, and 5 for DiNe from three embryos. C3: n = 3 for LC, 10 for NeNe, and 5 for DiNe from three embryos. ***p < 0.001. Scale bar, 10 μm.

