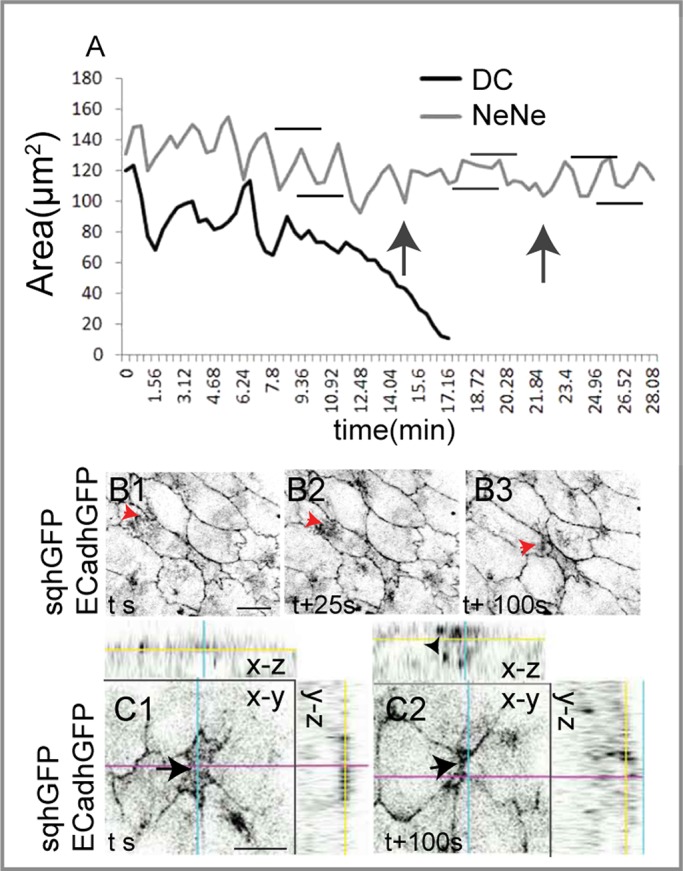
FIGURE 7:

Autonomous and nonautonomous membrane and myosin response in naturally delaminating cells. (A) Representative apical area dynamics of one naturally delaminating cell (black curve) and a NeNe (gray curve) showing pulse dampening (gray horizontal bars denote amplitude, and black arrows denote duration) during constriction or extrusion of the delaminating cell. Black horizontal bars show Amax and Amin before cell constriction or upon recovery from dampening. (B1–B3) Membrane (ECadh GFP) and myosin (sqhGFP) dynamics in the NeNe (red arrowheads) directed toward the delaminating cell. (C1, C2) Time-lapse images of a naturally delaminating cell showing the apical (arrow) and basal (arrowhead) myosin pools. Scale bar, 10 μm. See Supplemental Figures S6 and S7 for further examples.
