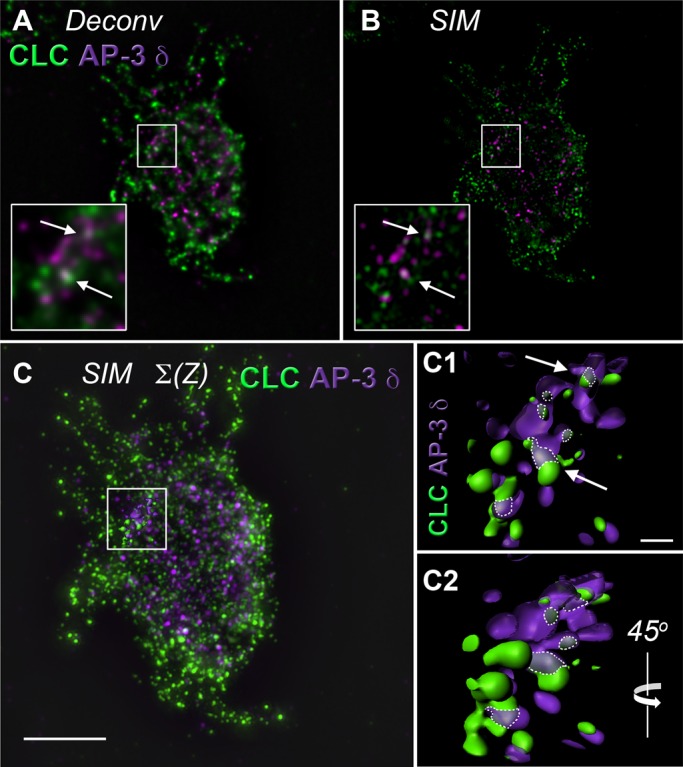
FIGURE 2:

Analysis of clathrin light-chain and AP-3 δ colocalization in PC12 cells using high-resolution deconvolution microscopy and superresolution structured illumination microscopy. (A) High-resolution deconvolution microscopy done in the Huygens algorithm and (B) Superresolution SIM of a single PC12-cell z-plane. Insert, threefold enlargement of the boxed region. Arrows direct attention to discrete puncta showing colocalization between clathrin light chain (CLC) and AP-3 δ signals. (C) Isosurface rendering through 10 z-planes of SIM microscopy in B. Scale bar, 5 μm. Boxed region includes surface reconstruction enlarged in C1 and C2. (C1) Arrows draw attention to the same discrete puncta in A and B. Dotted lines outline area of colocalization. Scale bar, 0.5 μm. (C2) A 45° rotation of C1 around a vertical axis. See Supplemental Movie S1.
