FIGURE 3:
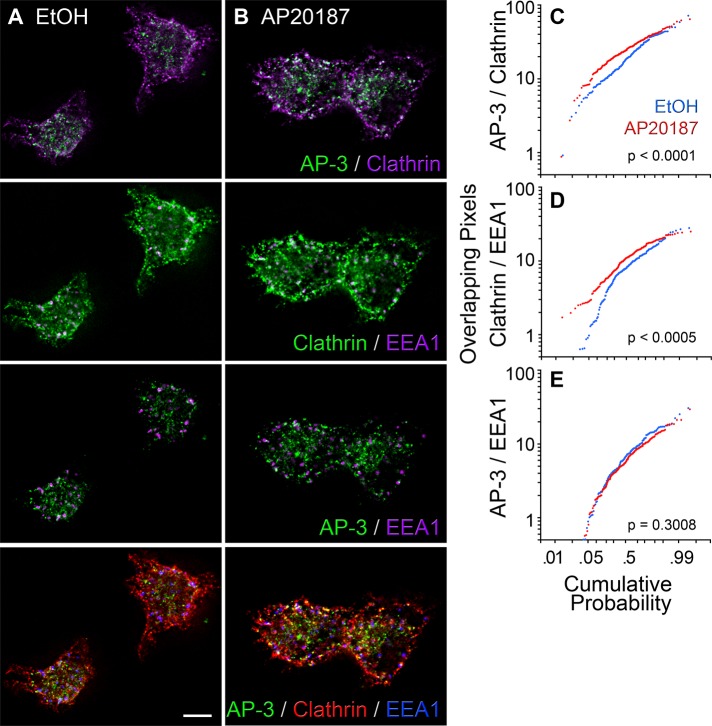
Analysis of clathrin light-chain and AP-3 δ colocalization in PC12-cell early endosomes. (A, B) High-resolution deconvolution microscopy of PC12 cells incubated in the presence of vehicle or AP20187 and triple labeled with antibodies against AP-3 δ, the mCherry tag in mCh-FKBP-CLC, and EEA1. Scale bar, 5 μm. (C–E) Probability plots of the extent of pixel overlap among marker pairs (Y axis) in cells treated with vehicle (blue traces) and AP20187 (red traces). The p values were determined using the Kolmogorov–Smirnov test. Vehicle, n = 167 endosomes from 55 cells acquired from three biological replicates. AP20187, n = 203 endosomes from 68 cells acquired from three biological replicates.

