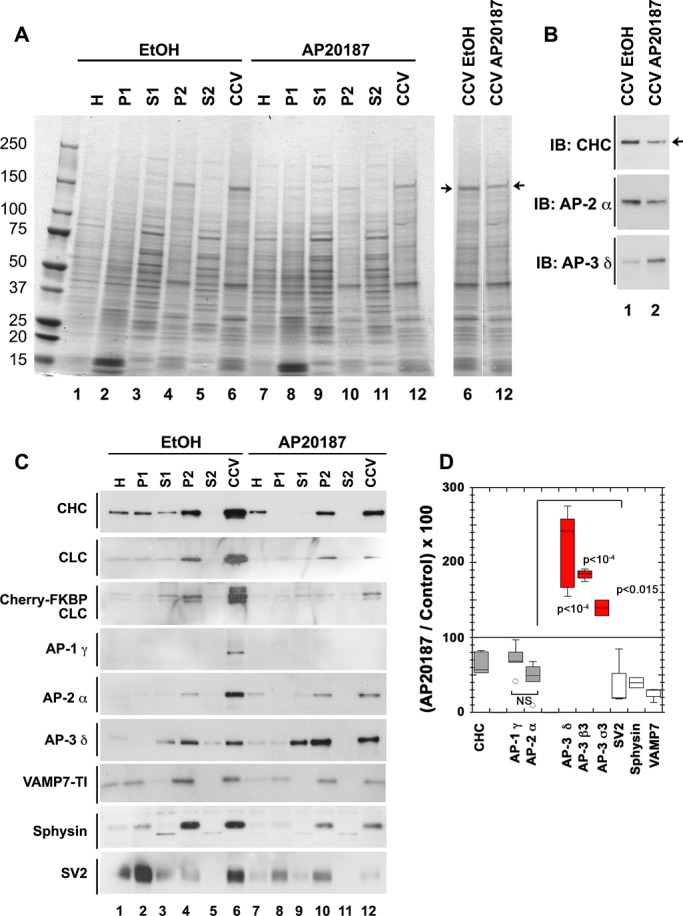
FIGURE 5:

AP-3 levels increase in clathrin-coated vesicle fractions after acute clathrin function perturbation. (A) Coomassie stain of SDS–polyacrylamide gel loaded with fractions of CCVs isolated from PC12 cells stably expressing mCh-FKBP-CLC. Cells were treated for 2 h with vehicle (lanes 1–6) or the drug AP20187 to acutely perturb clathrin function (lanes 7–12). Arrows direct attention to a band that runs consistent with clathrin heavy-chain molecular weight. (B) Western blot of CCVs fraction from A. Arrow draws attention to a band in clathrin heavy-chain immunoblot that shows a decrease in the CCV fraction from cells with acute clathrin perturbation compared with vehicle control. Decrease in clathrin signal from CCV fraction of drug-treated cells indicates that acute clathrin perturbation affects clathrin vesicle formation. (C) Western blots of clathrin-coated vesicle isolation fractions from PC12 cells stably expressing mCherry-FKBP-CLC treated for 2 h with either vehicle control (lanes 1–6) or the drug AP20187 to perturb clathrin function (lanes 7–12). (D) Densitometry quantification of CCV fraction from three biological replicates each with at least two technical replicates of clathrin coated–vesicle isolations in PC12 cells stably expressing mCh-FKBP-CLC and treated for 2 h with either vehicle control or AP20187 to acutely perturb clathrin function. AP-3 subunits display significantly higher signals in CCV fractions from AP20187-treated cells compared with vehicle control–treated cells despite decreases in other adaptor subunits like AP-1 γ and AP-2 α. The extent of decrease in AP-1 γ and AP-2 α in CCV fraction treated with AP20187 compared with control is similar, as highlighted by the nonsignificance when these two are compared (not significant [NS]). CCV, clathrin-coated vesicle fraction; H, homogenate; IB, immunoblot; P1, pellet 1; P2, pellet 2; S1, supernatant 1; S2, supernatant 2; p values, analysis of variance multiple comparisons with Student–Newman–Keuls post hoc test.
