
FIGURE 6:
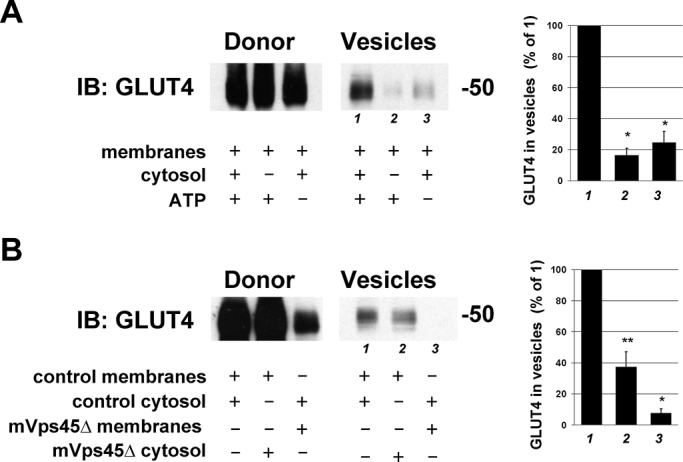
Impaired GLUT4 trafficking revealed using an in vitro assay. (A) Budding assays were performed as described in Materials and Methods first using control cells. Donor membranes from control cells were incubated in the presence of cytosol and ATP (or certain components omitted as indicated on the figure) and incubated at 37°C for 20 min before centrifugation to repellet the donor membranes. GLUT4 levels in the donor and supernatant (Vesicle) fractions were assayed by immunoblotting. Data from a typical experiment are shown, repeated three times with similar results. GLUT4 levels in the vesicles (lanes 1–3) were quantified by image analysis and expressed as percentage of the value for lane 1. Values of mean ± SD are shown in the graph to the right. Asterisk indicates a significant reduction compared with lane 1, p = 0.01. (B) The same assay, this time using combinations of donor and cytosol fractions isolated from random shRNA-treated cells or mVps45-depleted cells. The indicated fractions were incubated in the presence of an ATP-regenerating system at 37C for 20 min and the donor and vesicle fractions immunoblotted for GLUT4. The blot shown is from a representative experiment repeated five times with quantitatively similar results. GLUT4 levels in the vesicles (lanes 1–3) were quantified by image analysis and expressed as percentage of the value for lane 1. Values of mean ± SD are shown in the graph to the right. Statistically significant reductions are indicated by *p = 0.01 and **p = 0.05.