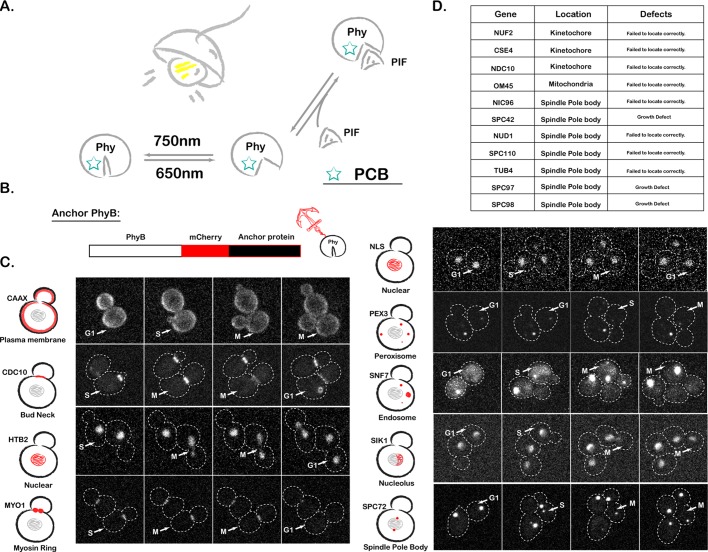
FIGURE 1:
PhyB anchor library construction. (A) Schematic of the PhyB-PIF interaction. (B) Schematic of PhyB anchor library construction. (C) Fluorescence images of our library of PhyB anchor strains, with dashed lines representing cell boundaries. CAAX, plasma membrane targeting sequence; NLS, nuclear localization signal; NES, nuclear export signal. For each strain, example images from all three cell cycle phases are shown. We show an extra image for cell cycle phases when there was particular interest in the dynamics. Stacks of nine images were acquired every 3 min at 30°C, and the maximum-intensity projection of the image stack is shown. (D) List of anchor proteins for which the PhyB fusions were not successful.

