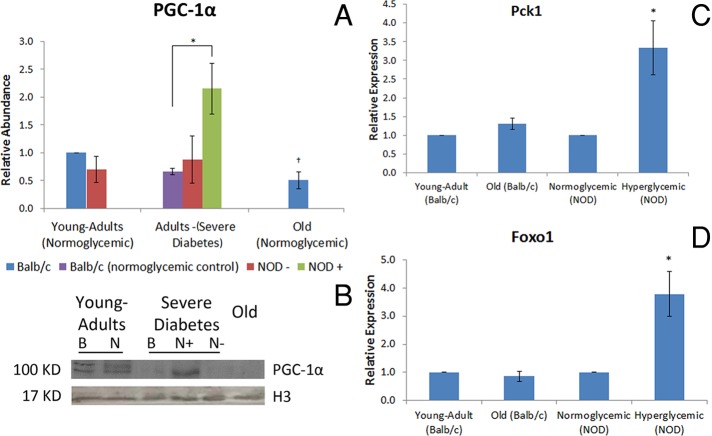
FIGURE 2:
PGC-1α presents the same abundance pattern as Sirt1 and activates its targets in hyperglycemic animals. (A) PGC-1α relative abundance, determined by Western blotting. *Difference significant at p < 0.05 by ANOVA. †Difference significant at p < 0.05 by Student's t test. (C) PGC-1α representative image of the immunoblotting. Image was chosen to specifically highlight the differences shown in the graph. B, BALB/c; N, NOD. Histone H3 was used as the loading control. +, Hyperglycemia; –, normoglycemia. (C) Pck1 and (D) Foxo1 expression, determined by quantitative PCR. *Difference significant in comparison to normoglycemic NOD mice at p < 0.05 by Student's t test.

