FIGURE 6:

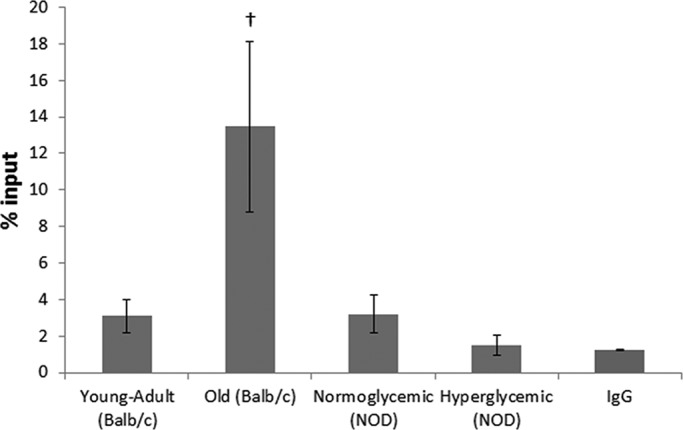
Native ChIP from mouse hepatocytes as percentage of input. IgG was used as mock control. †Difference significant at p < 0.05 by Student's t test.

Native ChIP from mouse hepatocytes as percentage of input. IgG was used as mock control. †Difference significant at p < 0.05 by Student's t test.