
Figure 1.
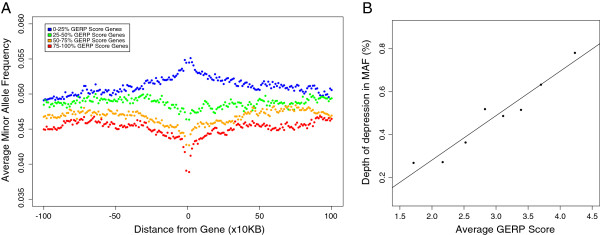
The relationship between the average GERP score of a gene and the MAF of polymorphisms in the surrounding regions. Genes were split into quartiles based on average GERP score and the average MAF calculated in the sequences surrounding coding regions (A). The correlation between the depth of the depression in minor allele frequency and the average GERP score of genes in each of the top eight GERP score bins (B).