
Figure 4.
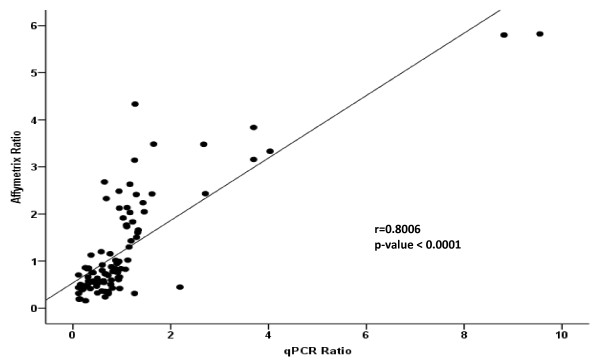
Correlation of qPCR and microarray data. Scatter plot shows Correlation of the ratios from the microarray and real-time PCR data set. Genes that differed significantly (P < 0.01) in their regulation between the diet groups’ microarray analysis were selected and validated with the same samples by qPCR analysis. Ratios of expressions between the diet comparisons calculated from the microarray data set correlated well with the ratio calculated from the qPCR data (r = 0.641, P < 0.0001). A complete list of these genes is shown in Additional file 2.