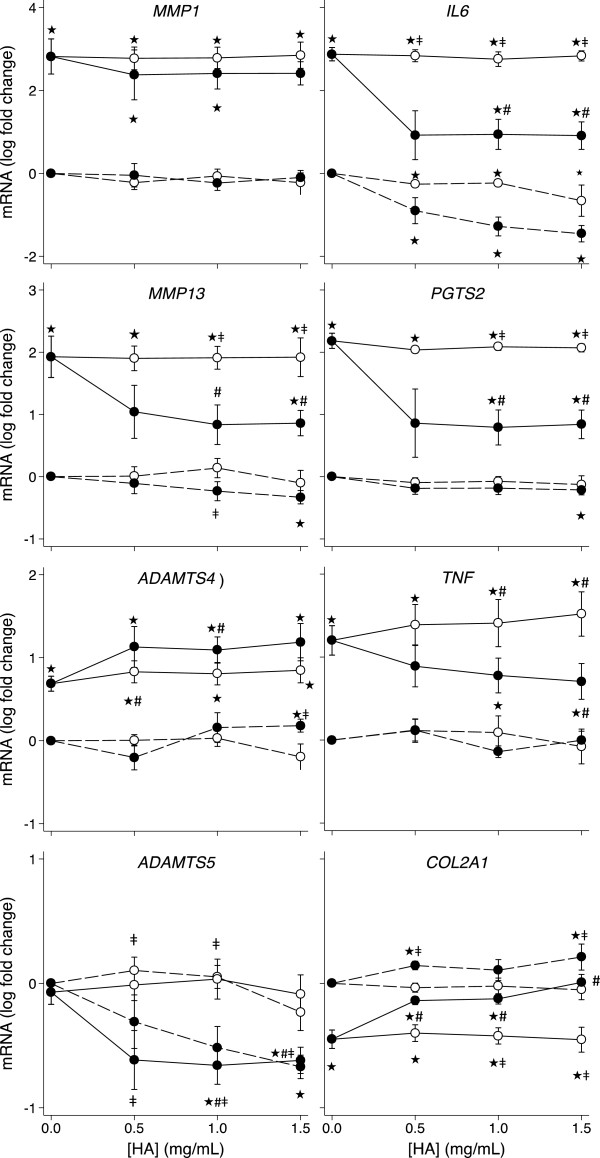
Figure 1.
HA dose response of HAC gene expression. Dose response of unmodified HA (white markers) and the amide derivative of HA (black markers) on HAC expression of the indicated genes in the presence (solid line) and absence (dashed line) of IL-1β (2 ng/mL). Values are mean log fold-change from control (no IL-1 no HA; at zero) from six separate patients. Note different scales within each row. P < 0.05* different from no IL-1, no HA control; # different from IL-1, no HA control; ‡ different between the amide derivative and unmodified HA at the same concentration.

