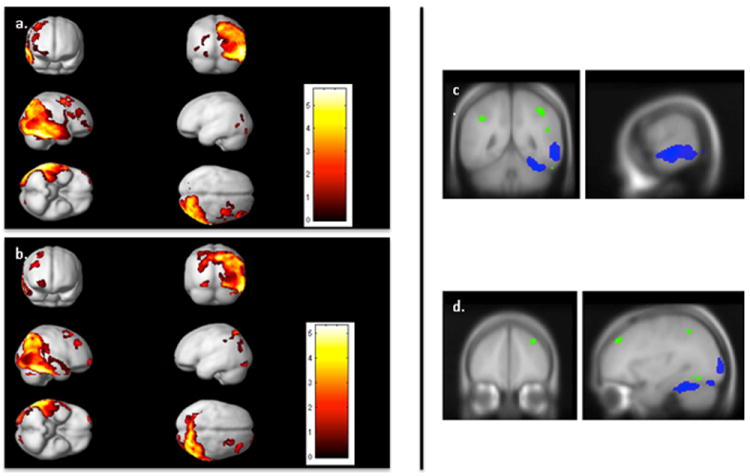
Figure 2. Association between GLOB/DET and cerebral metabolism.

The left side includes SPM results (p<.05 FDR corrected, extent=50 voxels) displayed on the smoothed average brain in SPM2 demonstrating the correlation between (a) GLOB and metabolism and (b) DET and metabolism. The right side illustrates the unique contribution of GLOB after controlling for DET, and DET after controlling for GLOB (p<.005, uncorrected, extent=10 voxels). GLOB in blue and DET in green, through (a) the temporal cortex (x=64, y=-48), and (b) the PFC (x=33, y=44).
