
Figure 6.
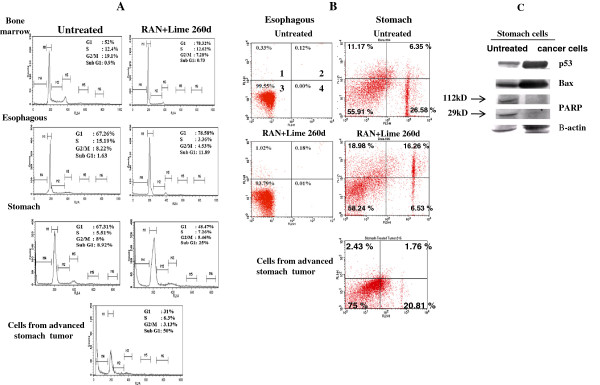
Analysis of cell cycle and apoptosis in mice treated with RAN with lime (A) Analysis of cell cycle after 260 days of exposure with RAN extract with lime in bone marrow, esophagus and stomach cells of mouse and also from stomach tumor cells. (B) Representative cytograms of Annexin V versus PI fluorescence intensities as determined by flow cytometric analysis in mouse esophagus and stomach cells after 260 days of exposure with RAN with lime and from stomach tumor cells. Within a cytogram, quadrant 1 and 2 represent early and late apoptotic cells, respectively; quadrant 3, viable cells; quadrant 4, dead cells. (C) Western blotting for apoptotic markers in normal (untreated) and tumor stomach cells. β-actin was used as loading control.