
Figure 7.
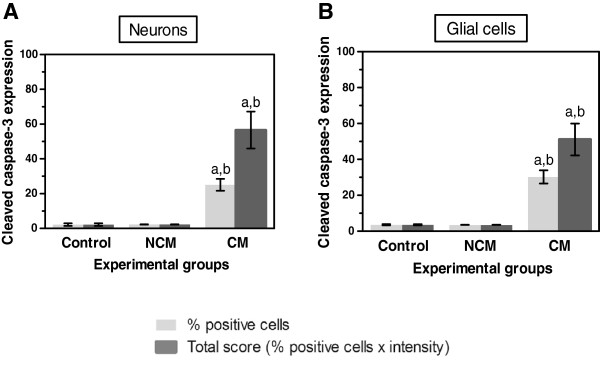
Quantification of cleaved caspase-3 expression in neurons (A) and glial cells (B) in the brain of the control, NCM, and CM groups. aSignificance of p < 0.001 compared with control brain (Mann–Whitney U test). bSignificance of p = 0.034 compared with NCM (Mann–Whitney U test). Data are presented as mean ± SEM.