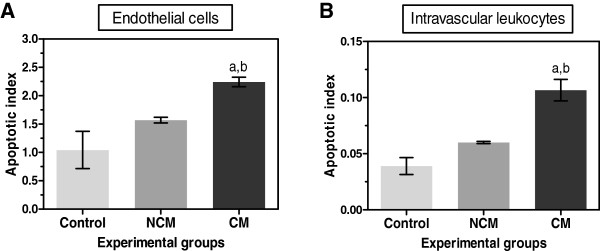
Figure 9.

Quantification of cleaved caspase-3 in vascular ECs and intravascular leukocytes in the brain of control, NCM and CM groups. Data were analysed as apoptotic index in the vascular ECs (A) and intravascular leukocytes (B). aSignificance of p < 0.001 compared with control brain (Mann–Whitney U test). bSignificance of p = 0.034 compared with NCM (Mann–Whitney U test). Data are presented as mean ± SEM.
