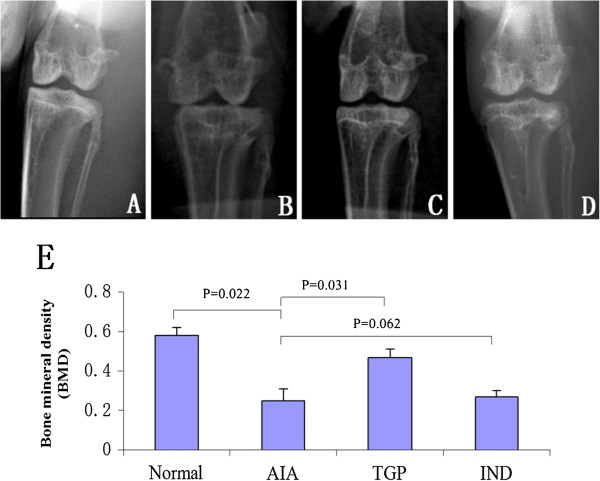
Figure 1.
Representative X-ray photographs of knee bone and BMD of knees in each group of rabbits. (A) Normal group (B) AIA group (C) TGP group (D) IND group (E): Densitometric analysis of bone mineral density (BMD, g/cm2) in the subchondral bones for each group of rabbits. Results are presented as mean ± S.D.

