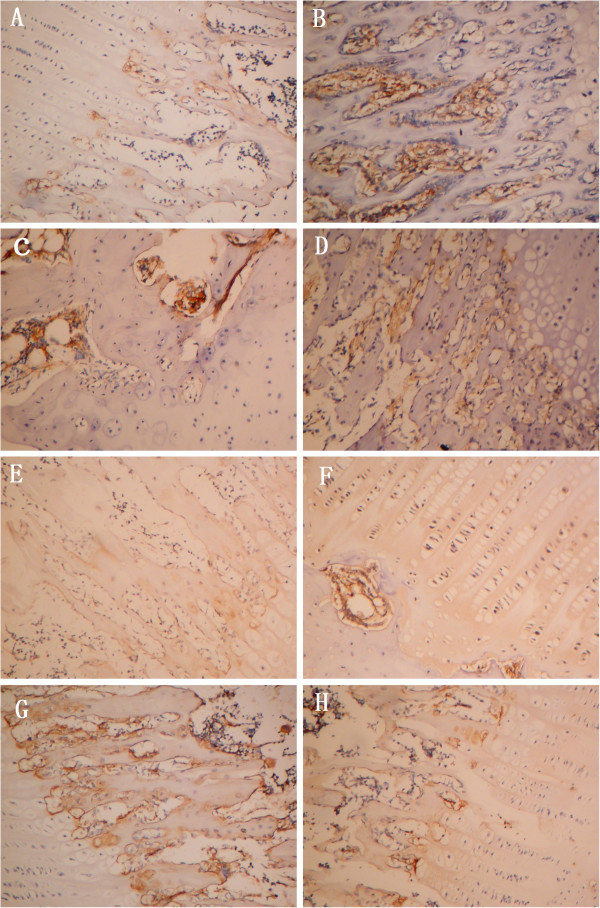
Figure 4.
RANKL and OPG expression in articular cartilage and subchondral bone. Histological sections were submitted for immunohistochemical analyses. RANKL staining is shown in each group in Figure 4(A-D): (A) Normal group. RANKL immunolabeling was rarely detected. (B) AIA group. RANKL immunolabeling was detected at high levels, especially in subchondral bone. (C) TGP group. TGP decreased RANKL expression. (D) IND group. OPG staining for each group is shown in Figure 4(E-H): (E) Normal group. OPG was expressed only in deep zone. (F) AIA group (G) TGP group. OPG was highly expressed in subchondral bone. (H) IND group (original magnification × 400).

