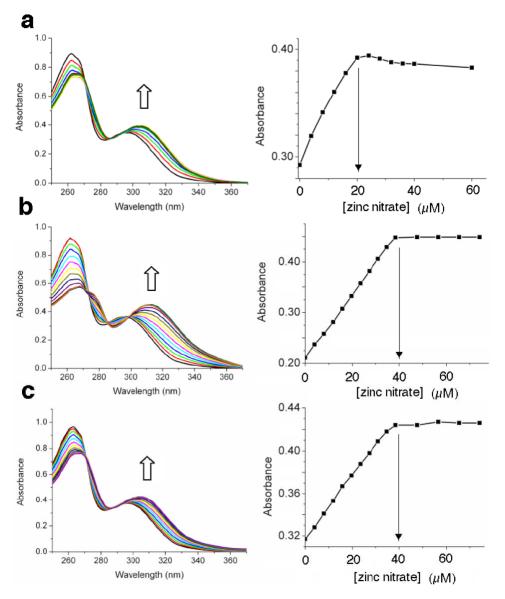
Figure 3.
(a) Absorbance spectra of L3 (20 μM) upon titration of Zn(NO3)2 in methanol/water (4:1 volume ratio); (b) same titration repeated in the presence of Na4PPi (40 μM); (c) same titration repeated in the presence of NaOAc (40 μM). In each case, the graph on the right shows absorbance intensity change for the spectral wavelength maxima band.

