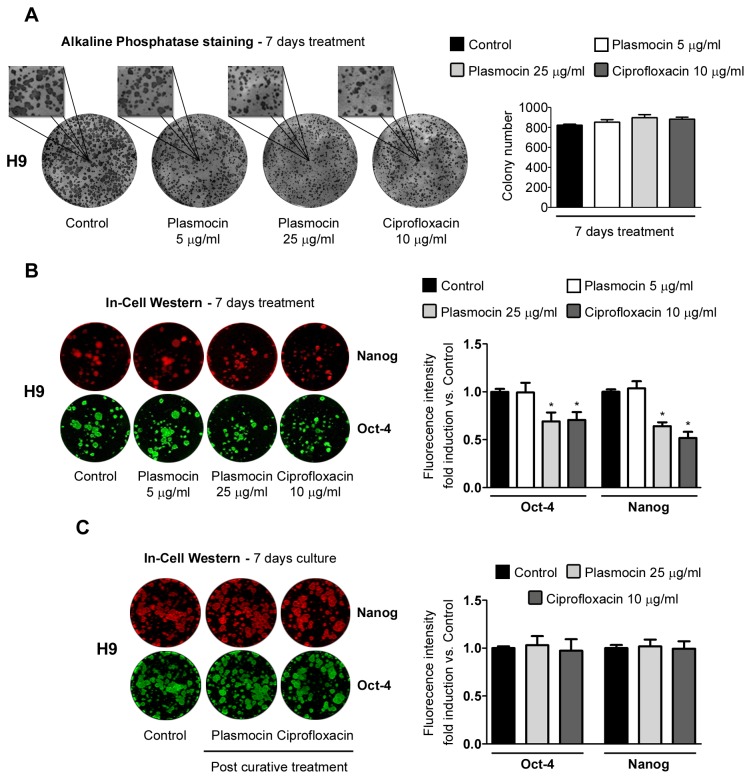
Figure 7. Cell growth of hESCs treated with PlasmocinTM and Ciprofloxacin.
(A) Alkaline phosphatase staining of H9 cells grown on iMEF feeder layer after 7 days of treatment with PlasmocinTM (5 or 25 µg/ml) or Ciprofloxacin (10 µg/ml). Control: untreated cells. Representative images and 250% magnifications are shown. Colony number is graphed. Bars indicate mean ± S.E. of three independent experiments. * = p<0.05. (B) In-Cell Western analysis of Nanog and Oct-4 stemness markers on H9 cells grown on iMEF feeder layer after 7 days of treatment with PlasmocinTM (5 or 25 µg/ml) or Ciprofloxacin (10 µg/ml). Control: untreated cells. Representative images are shown. Fluorescence intensity fold induction vs. Control is shown. Bars indicate mean ± S.E. of three independent experiments. * = p<0.05. (C) After 14 days PlasmocinTM (25 µg/ml) or Ciprofloxacin (10 µg/ml) "curative" treatments, antibiotics were removed and H9 cells were passaged twice and then grown on iMEF feeder layer for 7 days under regular culture media conditions in order to study Nanog and Oct-4 stemness markers expression by In-Cell Western. Control: untreated cells. Representative images are shown. Fluorescence intensity fold induction vs. Control is shown. Bars indicate mean ± S.E. of three independent experiments. *=p<0.05.

