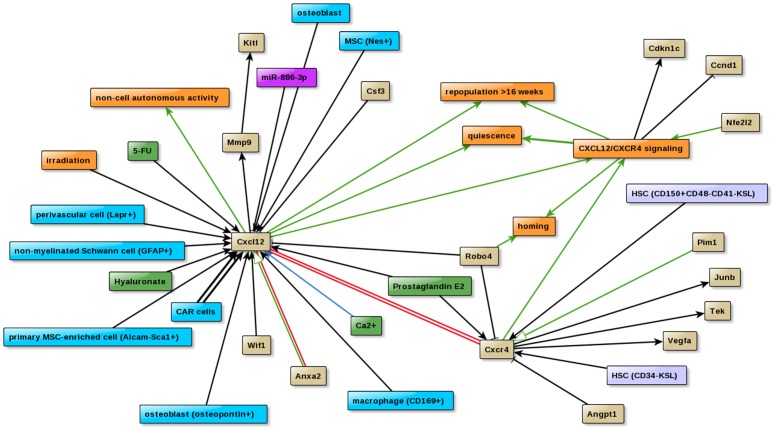
Figure 2. Graphical presentation of the ‘Cxcl12/Cxcr4 signaling’ network.
The graph illustrates the process of Cxcl12/Cxcr4 signaling (described in the text) based on the interactions between heterogeneous factors such as proteins (beige), bioprocesses (orange), chemical compounds (green), niche cell types (cyan), hematopoietic stem/progenitor cells (light blue) and a microRNA (purple).

