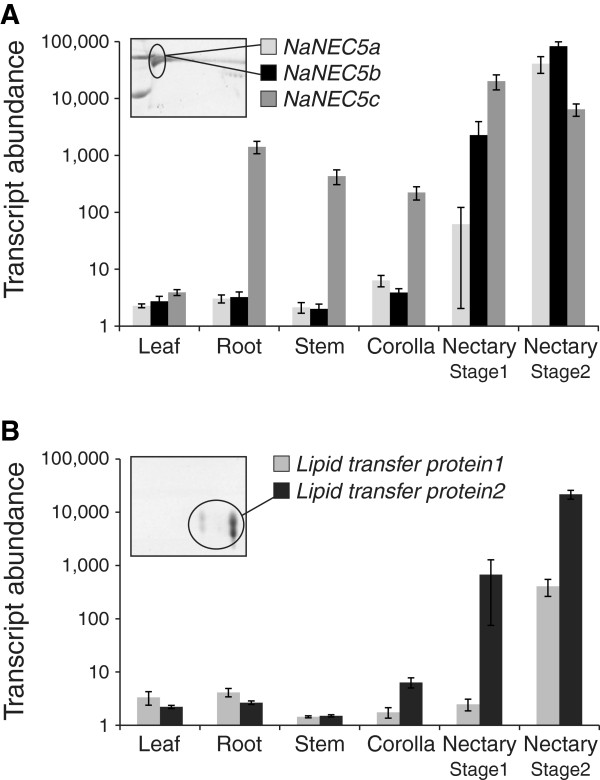
Figure 5.
Tissue-specific transcript expressions of NaNEC5s and lipid transfer proteins. The transcript levels of three nectarin5-like genes (A) and two lipid transfer proteins (B) in leaf, root, stem, corolla, and nectary of N. attenuata. The mean intensities (±SE) of normalized expression for each gene are plotted on the y-axis in a logarithmic scale.

