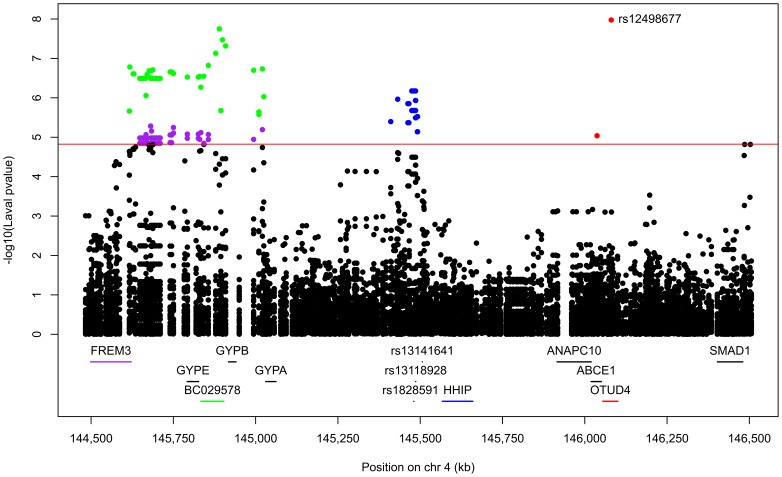
Figure 5. Lung eQTLs on 4q31 in the Laval dataset.
Each dot represents an association test between one SNP and one probeset. Only dots above the red line are significant (p<1.5×10⁻⁵). Significant SNPs were regulating the expression levels of BC029578 in green, FREM3 in purple, HHIP in blue, and OTUD4 in red. The SNP with the smaller p-value is indicated. SNPs previously associated with COPD are presented at the bottom.

