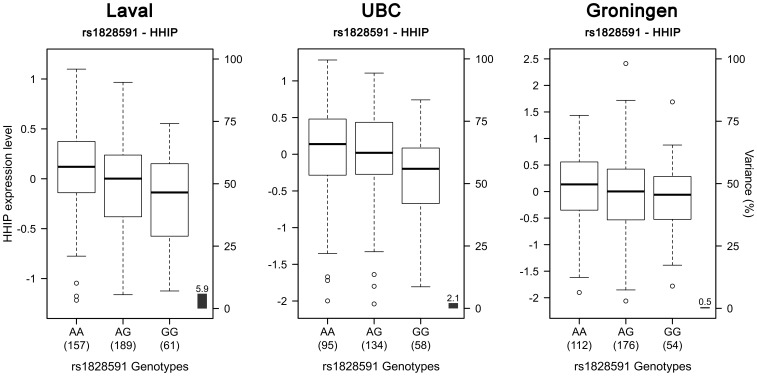
Figure 7. Boxplots of gene expression levels in the lung for HHIP according to genotype groups for SNP rs1828591.
The left y-axis shows the mRNA expression levels for HHIP. The x-axis represents the three genotype groups for SNP rs1828591. The right y-axis shows the proportion of the gene expression variance explained by the SNP (black bar). Each panel represents a different cohort: Laval (n = 407), UBC (n = 287), Groningen (n = 342). The eQTL p-values were 6.7×10⁻⁷, 0.013 and 0.214, respectively.

