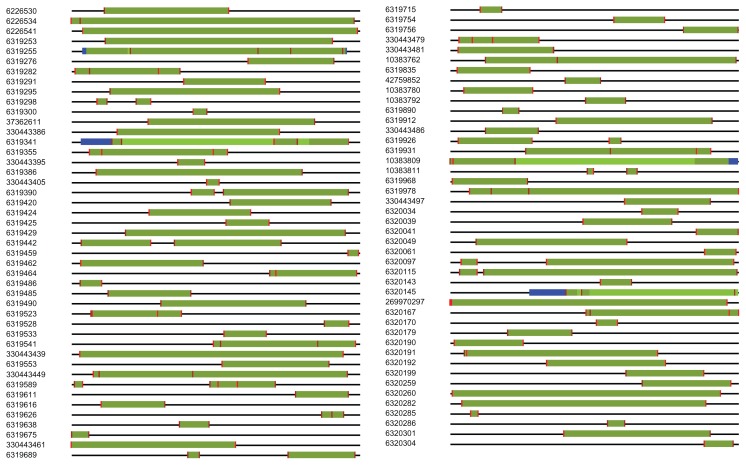
Figure 3.
The scheme represents all LPSs found with the original LPS algorithm and with SARP in a set of 1000 yeast proteins. The numbers are the GI numbers of proteins in the NCBI database. The horizontal black line represents a protein sequence. Different green regions represent overlapping LPSs found with the original algorithm and SARP. Blue regions denote parts of an LPS that were not identified by the original algorithm. Vertical red dashes denote an exact match of the LPS boundaries found with the original LPS algorithm and SARP.

