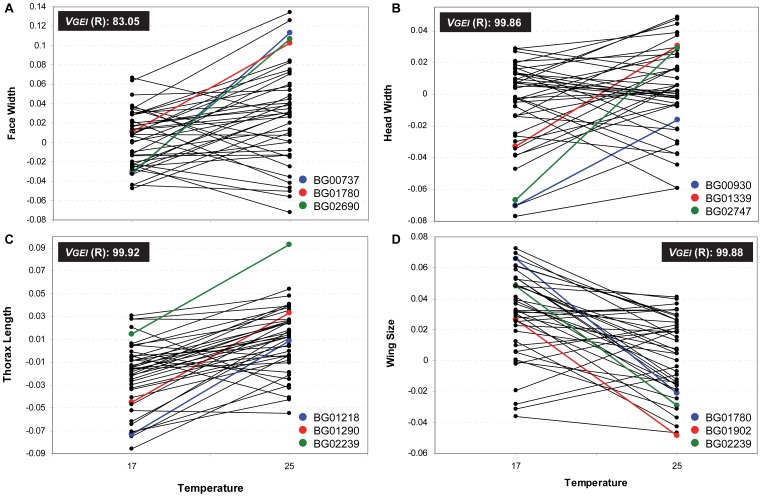
Figure 3. Genotype by environment interaction for each body size related trait in males.
Line by temperature interaction in males for A) Face Width, B) Head Width, C) Thorax Length and D) Wing Size. Each dot corresponds to the average of the transformed values. VGEI (R) is the percentage of GEI’s variance explained by changes in ranking order. The three lines showing the largest significant differences between temperatures are coloured.

