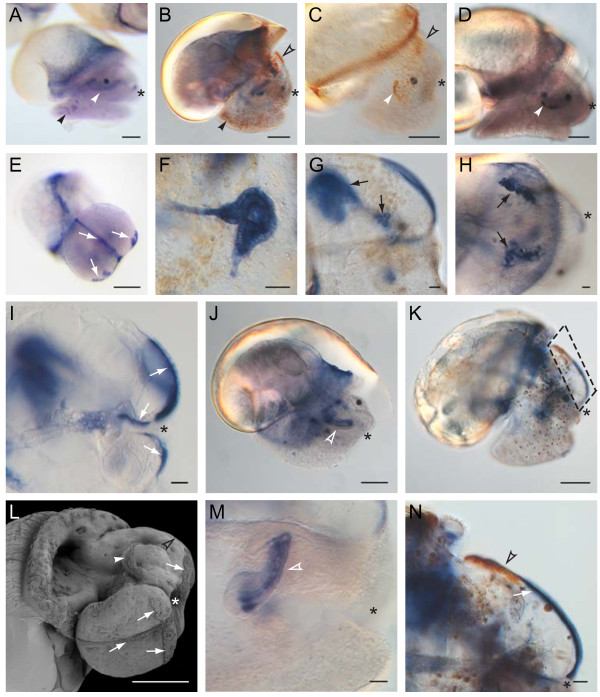
Figure 7.
Endogenous alkaline phosphatase (AP) and peroxidase (PO) activities as markers of larval development. Other organs and cell populations not involved in shell formation display AP and PO activity. Endogenous AP activity can be found in most ciliated fields (E and I, white arrows), including the apical plate (G, I, K, N), the protonephridia (F-H, black arrows), the developing radula (J and M, white open arrowhead) and dispersed cells throughout the foot (A, black arrowhead). Peroxidase positive structures include the head vesicle cells (B, C, K and N, black open arrowheads), the velum (C, white arrowhead) and scattered cells throughout the foot and head tissue (B, black arrowhead, and K respectively). N is a detailed view of the boxed area in K. L is an SEM from a lateral/ventral perspective of a 5+ dpfc staged larva illustrating the ciliated fields of the foot and head (white arrows) and the velum (white arrow head). A-D, H, J and M show larvae of 5+dpfc, F shows a 77 hpfc old larva, I shows a 97 hpfc old larva and E, G, K and N show 117 hpfc old larvae. The position of the stomodaeum is marked by an asterisk. Scale bars are 20 μm (F-I, M and N) or 100 μm (A-E, J, K, L). Panels B, G, I, K, and N are reflected about the vertical axis for clarity of presentation.

