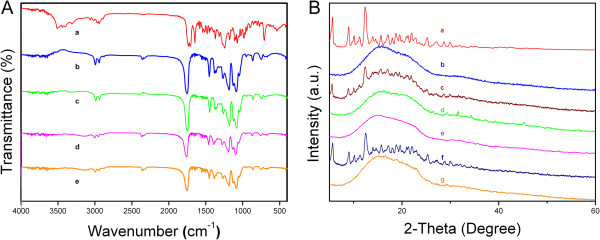
Figure 2.

FTIR and XRD analysis of the PTX, physical mixture, and drug-loaded NPs. (A) FTIR spectra of PTX (a), PLA NPs (b), PTX-PLA NPs (c), MPEG-PLA NPs (d), and PTX-MPEG-PLA NPs (e). (B) XRD patterns of PTX (a), PLA NPs (b), physical mixture of PTX and PLA NPs (c), PTX-PLA NPs (d), MPEG-PLA NPs (e), physical mixture of PTX and MPEG-PLA NPs (f), and PTX-MPEG-PLA NPs (g).
