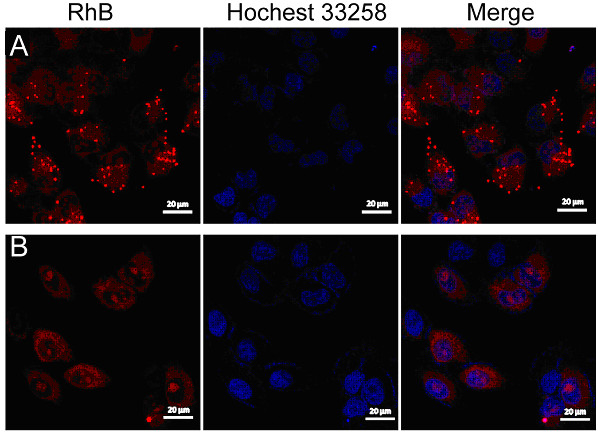
Figure 6.

CLSM images of cells incubated with PTX-loaded NPs which were labeled by rhodamine B. For each panel, the images from left to right showed rhodamine B fluorescence in cells (red), cell nuclei stained by Hochest 33258 (blue), and overlays of the two images. (A) PTX-PLA NPs, (B) PTX-MPEG-PLA NPs.
