
Figure 7.
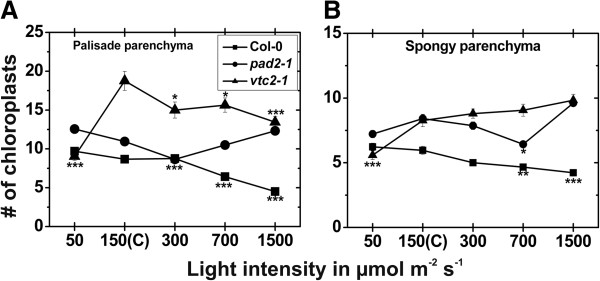
Number of chloroplasts after the exposure to different light intensities for 14 d. Number of chloroplasts per cell on longitudinal semithin-sections of the upper palisade cell layer (A) and the spongy parenchyma (B) in leaves of the wildtype (Col-0), the pad2-1 and the vtc2-1 mutants after the exposure to different light intensities for 14 d. Data are means with standard errors. Significant differences were calculated within one line of plants between control conditions (exposure to 150 μmol m-2 s-1) and the same line exposed to the other light intensities by using the Mann Whitney U-test; *, ** and ***, respectively, indicate significance at the 0.05, 0.01 and 0.001 levels of confidence. n > 100 chloroplasts per treatment.